Documentation


Table of Contents
19 Éléments
Un élément est un test (métrique) de performance ou de disponibilité.
19.1 Clé de l'élément
19.1.1 Paramètes flexibles et non-flexibles
Un paramètre flexible est un paramètre qui accepte des arguments. Par exemple, vfs.fs.size[*] est un paramètre flexible. * signifie que n'importe quel caractère peut être passé en argument au paramètre. Voici des exemples de configuration valides:
- vfs.fs.size[/]
- vfs.fs.size[/opt]
19.1.2 Format de la clé
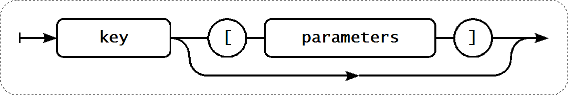
Le format de la clé de l'élément, y compris les paramètres clés, doit suivre des règles de syntaxe. L'illustration suivante représente la syntaxe supportée. Les éléments et caractères autorisé à chaque point peuvent être déterminés en suivant les lignes - "Si certains blocs peuvent être atteint par le biais de la ligne, c'est permis, sinon cela ne l'est pas" if some block can be reached through the line, it is allowed, if not - it is not allowed.
Clé d'élément
Pour construire une clé d'élément valide, on commence par spécifier le nom de la clé, ensuite on choisit ou non de renseigner un ou plusieurs paramètres comme représenté sur les deux lignes du schéma ci-dessous.
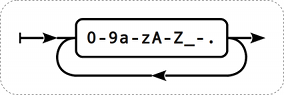
Nom de la clé
Le nom de la clé à une gamme limité de caractères autorisés. Les caractères autorisés sont:
Ce qui signifie:
- Tous les nombres;
- Toutes les lettres en minuscule;
- Toutes les lettres en majuscule;
- underscore "_";
- tiret "-";
- point ".";
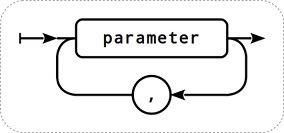
Paramètres de la clé
Une clé d'item peut avoir plusieurs paramètres, séparés par une virgule.
Paramètre de clé individuel
Chaque paramètre de clé peut être déclaré entre guillemets, sans guillemet ou en tableau.
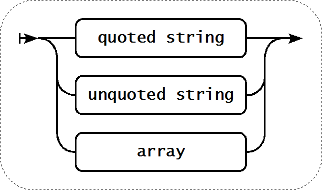
Un paramètre peut aussi être laissé vide, la valeur par défaut est alors utilisée. Dans les cas appropriés, un certain nombre de virgules doivent être ajoutée sur des paramètres supplémentaires sont ajoutés. Par exemple, la clé d'élément icmpping[,,200,,500] spécifie que l'intervalle entre les pings est de 200 millisecondes, le timeout - 500 millisecondes, et tous les autres paramètres sont laissés à leur valeur par défaut.
Paramètre - déclaration entre guillemet
Si le paramètre de l'élément est déclarée entre guillemets, tous les caractères Unicode sont autorisés, en incluant les guillemets qui doivent être échappées par un antislash.
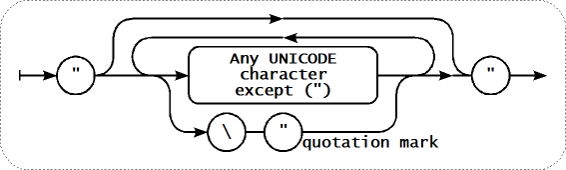
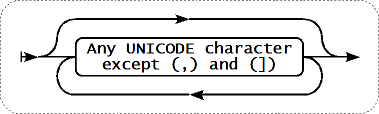
Paramètre - déclaration sans guillemet
Si le paramètre de l'élément est déclarée sans guillemets, tous les caractères Unicode sont autorisés excepté les virgules (,) et les crochets (]).
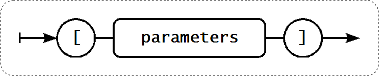
Paramètre - tableau
Si le paramètre de l'élément est un tableau, il est déclaré entre crochets, où les paramètres individuels respectent les règles et syntaxe des paramètres multiples.
19.1.3 Encodages disponibles
Le paramètre "encodage" est utilisé pour spécifier l'encodage pour les traitements correspondant aux vérifications des éléments, ainsi les données récoltées ne seront pas corrompues. Pour une liste des encodages supportés (code page identifiers), veuillez consulter la documentation respective, tel que pour libiconv (Projet GNU) ou Microsoft Windows SDK documentation pour "Code Page Identifiers". Si une valeur vide pour le paramètre "encodage" est passée, ANSI avec ses extensions systèmes spécifiques (Windows) ou UTF-8 (default locale for newer Unix/Linux distributions, see your system's settings) sont utilisés par défaut.
19.2 Unsupported items
An item can become unsupported if its value can not be retrieved for some reason. Such items are still rechecked at a fixed interval, configurable in Administration section.
19.3 Supported by Platform
In the following lists parameters that are included in angle brackets <like_this> are optional.
If an item is marked with "?", it is not known whether it is supported or not.
If an item is marked with "r", it means that it requires root privileges.
If a parameter is marked with "i", it means that it is ignored.
| Parameter / system | Windows | Linux 2.4 | Linux 2.6 | FreeBSD | Solaris | HP-UX | AIX | Tru64 | Mac OS X | OpenBSD | NetBSD | |
|---|---|---|---|---|---|---|---|---|---|---|---|---|
| agent.ping | X | X | X | X | X | X | X | X | X | X | X | |
| agent.version | X | X | X | X | X | X | X | X | X | X | X | |
| kernel.maxfiles | - | X | X | X | - | - | - | ? | ? | X | X | |
| kernel.maxproc | - | - | X | X | X | - | - | ? | ? | X | X | |
| log[file,<regexp>,<encoding>,<maxlines>,<mode>] | X | X | X | X | X | X | X | X | X | X | X | |
| logrt[file_format,<regexp>,<encoding>,<maxlines>,<mode>] | X | X | X | X | X | X | X | X | X | X | X | |
| eventlog[name,<regexp>,<severity>,<source>,<eventid>,<maxlines>,<mode>] | X | - | - | - | - | - | - | - | - | - | - | |
| net.if.collisions[if] | - | X | X | X | X | - | X | - | - | X | r | |
| net.if.in[if,<mode>] | X | X | X | X | X | - | X | - | - | X | r | |
| mode | bytes | X | X | X | X | X | - | X | - | - | X | r |
| packets | X | X | X | X | X | - | X | - | - | X | r | |
| errors | X | X | X | X | X | - | X | - | - | X | r | |
| dropped | X | X | X | X | - | - | - | - | - | X | r | |
| net.if.list | X | - | - | - | - | - | - | - | - | - | - | |
| net.if.out[if,<mode>] | X | X | X | X | X | - | X | - | - | X | r | |
| mode | bytes | X | X | X | X | X | - | X | - | - | X | r |
| packets | X | X | X | X | X | - | X | - | - | X | r | |
| errors | X | X | X | X | X | - | X | - | - | X | r | |
| dropped | X | X | X | - | - | - | - | - | - | - | - | |
| net.if.total[if,<mode>] | X | X | X | X | X | - | X | - | - | X | r | |
| mode | bytes | X | X | X | X | X | - | X | - | - | X | r |
| packets | X | X | X | X | X | - | X | - | - | X | r | |
| errors | X | X | X | X | X | - | X | - | - | X | r | |
| dropped | X | X | X | - | - | - | - | - | - | - | - | |
| net.tcp.dns[<ip>,zone] | - | X | X | X | X | X | X | X | X | X | X | |
| net.tcp.dns.query[<ip>,zone,<type>] | - | X | X | X | X | X | X | X | X | X | X | |
| net.tcp.listen[port] | X | X | X | X | X | - | - | - | - | - | - | |
| net.tcp.port[<ip>,port] | X | X | X | X | X | X | X | X | X | X | X | |
| net.tcp.service.perf[service,<ip>,<port>] | - | X | X | X | X | X | X | X | - | X | X | |
| net.tcp.service[service,<ip>,<port>] | - | X | X | X | X | X | X | X | - | X | X | |
| net.udp.listen[port] | - | X | X | - | - | - | - | - | - | - | - | |
| proc.mem[<name>,<user>,<mode>,<cmdline>] | - | X | X | X | X | - | X | X | ? | X | X | |
| mode | sum | - | X | X | X | X | - | X | X | ? | X | X |
| avg | - | X | X | X | X | - | X | X | ? | X | X | |
| max | - | X | X | X | X | - | X | X | ? | X | X | |
| min | - | X | X | X | X | - | X | X | ? | X | X | |
| proc.num[<name>,<user>,<state>,<cmdline>] | X | X | X | X | X | - | X | X | ? | X | X | |
| state | all | - | X | X | X | X | - | X | X | ? | X | X |
| sleep | - | X | X | X | X | - | X | X | ? | X | X | |
| zomb | - | X | X | X | X | - | X | X | ? | X | X | |
| run | - | X | X | X | X | - | X | X | ? | X | X | |
| sensor[device,sensor,<mode>] | - | X | - | - | - | - | - | - | - | X | - | |
| services[<type>,<state>,<exclude>] | X | - | - | - | - | - | - | - | - | - | - | |
| system.boottime | - | X | X | X | X | - | - | - | - | X | X | |
| system.cpu.intr | - | X | X | X | X | - | X | - | - | X | X | |
| system.cpu.load[<cpu>,<mode>] | X | X | X | X | X | X | - | X | ? | X | X | |
| mode | avg1 | X | X | X | X | X | X | - | X | ? | X | X |
| avg5 | X | X | X | X | X | X | - | X | ? | X | X | |
| avg15 | X | X | X | X | X | X | - | X | ? | X | X | |
| system.cpu.num[<type>] | X | X | X | X | X | X | X | - | - | X | X | |
| type | online | X | X | X | X | X | X | X | - | - | X | X |
| max | - | X | X | X | X | - | - | - | - | - | - | |
| system.cpu.switches | - | X | X | X | X | - | X | - | - | X | X | |
| system.cpu.util[<cpu>,<type>,<mode>] | X | X | X | X | X | X | X | X | ? | X | X | |
| type | user | - | X | X | X | X | X | X | X | ? | X | X |
| nice | - | X | X | X | - | X | - | X | ? | X | X | |
| idle | - | X | X | X | X | X | X | X | ? | X | X | |
| system | X | X | X | X | - | X | X | X | ? | X | X | |
| kernel | - | - | - | - | X | - | - | - | - | - | - | |
| iowait | - | - | X | - | - | - | X | - | - | - | - | |
| wait | - | - | - | - | X | - | - | - | - | - | - | |
| interrupt | - | - | X | X | - | - | - | - | - | X | - | |
| softirq | - | - | X | - | - | - | - | - | - | - | - | |
| steal | - | - | X | - | - | - | - | - | - | - | - | |
| mode | avg1 | X | X | X | X | - | X | X | X | ? | X | - |
| avg5 | X | X | X | X | - | X | X | - | ? | X | - | |
| avg15 | X | X | X | X | - | X | X | - | ? | X | - | |
| system.hostname | X | X | X | X | X | X | X | X | X | X | X | |
| system.localtime | X | X | X | X | X | X | X | X | X | X | X | |
| type | utc | X | X | X | X | X | X | X | X | X | X | X |
| local | X | X | X | X | X | X | X | X | X | X | X | |
| system.run[command,<mode>] | X | X | X | X | X | X | X | X | X | X | X | |
| mode | wait | X | X | X | X | X | X | X | X | X | X | X |
| nowait | X | X | X | X | X | X | X | X | X | X | X | |
| system.stat[resource,<type>] | - | - | - | - | - | - | X | - | - | - | - | |
| system.swap.in[<device>,<type>] | - | X | X | - | X | - | - | - | - | X | - | |
| type | count | - | X | X | - | X | - | - | - | - | X | - |
| sectors | - | X | X | - | - | - | - | - | - | - | - | |
| pages | - | X | X | - | X | - | - | - | - | X | - | |
| system.swap.out[<device>,<type>] | - | X | X | - | X | - | - | - | - | X | - | |
| type | count | - | X | X | - | X | - | - | - | - | X | - |
| sectors | - | X | X | - | - | - | - | - | - | - | - | |
| pages | - | X | X | - | X | - | - | - | - | X | - | |
| system.swap.size[<device>,<type>] | X | X | X | X | X | - | - | X | ? | X | - | |
| mode | free | X | X | X | X | X | - | - | X | ? | X | - |
| total | X | X | X | X | X | - | - | X | ? | X | - | |
| used | - | X | X | X | - | - | - | - | - | X | - | |
| pfree | - | X | X | X | X | - | - | - | ? | X | - | |
| pused | - | X | X | X | X | - | - | - | ? | X | - | |
| system.uname | X | X | X | X | X | X | X | X | - | X | X | |
| system.uptime | X | X | X | X | X | - | X | ? | ? | X | X | |
| system.users.num | - | X | X | X | X | X | X | X | - | X | X | |
| vfs.dev.read[device,<type>,<mode>] | - | X | X | X | X | - | - | - | - | X | - | |
| type | sectors | - | X | X | - | - | - | - | - | - | - | - |
| operations | - | X | X | - | X | - | - | - | - | X | - | |
| bytes | - | - | - | - | X | - | - | - | - | X | - | |
| sps | - | X | X | - | - | - | - | - | - | - | - | |
| ops | - | X | X | X | - | - | - | - | - | - | - | |
| bps | - | - | - | X | - | - | - | - | - | - | - | |
| mode | avg1 | - | X | X | X | - | - | - | - | - | i | - |
| avg5 | - | X | X | X | - | - | - | - | - | i | - | |
| avg15 | - | X | X | X | - | - | - | - | - | i | - | |
| vfs.dev.write[device,<type>,<mode>] | - | X | X | X | X | - | - | - | - | X | - | |
| type | sectors | - | X | X | - | - | - | - | - | - | - | - |
| operations | - | X | X | - | X | - | - | - | - | X | - | |
| bytes | - | - | - | - | X | - | - | - | - | X | - | |
| sps | - | X | X | - | - | - | - | - | - | - | - | |
| ops | - | X | X | X | - | - | - | - | - | - | - | |
| bps | - | - | - | X | - | - | - | - | - | - | - | |
| mode | avg1 | - | X | X | X | - | - | - | - | - | i | - |
| avg5 | - | X | X | X | - | - | - | - | - | i | - | |
| avg15 | - | X | X | X | - | - | - | - | - | i | - | |
| vfs.file.cksum[file] | X | X | X | X | X | X | X | X | - | X | X | |
| vfs.file.contents[file,<encoding>] | X | X | X | X | X | X | X | X | X | X | X | |
| vfs.file.exists[file] | X | X | X | X | X | X | X | X | X | X | X | |
| vfs.file.md5sum[file] | X | X | X | X | X | X | X | X | - | X | X | |
| vfs.file.regexp[file,regexp,<encoding>] | X | X | X | X | X | X | X | X | - | X | X | |
| vfs.file.regmatch[file,regexp,<encoding>] | X | X | X | X | X | X | X | X | - | X | X | |
| vfs.file.size[file] | X | X | X | X | X | X | X | X | - | X | X | |
| vfs.file.time[file,<mode>] | X | X | X | X | X | X | X | X | - | X | X | |
| mode | modify | X | X | X | X | X | X | X | X | - | X | X |
| access | X | X | X | X | X | X | X | X | - | X | X | |
| change | X | X | X | X | X | X | X | X | - | X | X | |
| vfs.fs.inode[fs,<mode>] | - | X | X | X | X | X | X | X | ? | X | X | |
| mode | total | - | X | X | X | X | X | X | X | ? | X | X |
| free | - | X | X | X | X | X | X | X | ? | X | X | |
| used | - | X | X | X | X | X | X | X | ? | X | X | |
| pfree | - | X | X | X | X | X | X | X | ? | X | X | |
| pused | - | X | X | X | X | X | X | X | ? | X | X | |
| vfs.fs.size[fs,<mode>] | X | X | X | X | X | X | X | X | ? | X | X | |
| mode | total | X | X | X | X | X | X | X | X | ? | X | X |
| free | X | X | X | X | X | X | X | X | ? | X | X | |
| used | X | X | X | X | X | X | X | X | ? | X | X | |
| pfree | X | X | X | X | X | X | X | X | ? | X | X | |
| pused | X | X | X | X | X | X | X | X | ? | X | X | |
| vm.memory.size[<mode>] | X | X | X | X | X | X | X | X | ? | X | X | |
| mode | total | X | X | X | X | X | X | X | X | ? | X | X |
| free | X | X | X | X | X | X | X | X | ? | X | X | |
| used | - | - | - | X | - | - | - | - | - | X | X | |
| shared | - | X | X | X | - | X | X | - | ? | X | X | |
| buffers | - | X | X | - | - | X | X | - | ? | X | X | |
| cached | X | X | X | X | - | X | X | - | ? | X | X | |
| pfree | X | X | X | X | - | - | - | - | - | X | X | |
| pused | - | - | - | X | - | - | - | - | - | X | X | |
| available | - | X | X | - | - | - | - | - | - | - | - | |
| web.page.get[host,<path>,<port>] | X | X | X | X | X | X | X | X | X | X | X | |
| web.page.perf[host,<path>,<port>] | X | X | X | X | X | X | X | X | X | X | X | |
| web.page.regexp[host,<path>,<port>,<regexp>,<length>] | X | X | X | X | X | X | X | X | X | X | X | |
| Parameter / system | Windows | Linux 2.4 | Linux 2.6 | FreeBSD | Solaris | HP-UX | AIX | Tru64 | Mac OS X | OpenBSD | NetBSD | |
19.4 Zabbix Agent
List of supported parameters
| Key | Description | Return value | Parameters | Comments |
|---|---|---|---|---|
| agent.ping | Check the agent availability. | Returns '1' if agent is available, nothing if unavailable. | - | Can be used as a TCP ping. Use function nodata() to check for host unavailability. |
| agent.version | Version of Zabbix Agent. | String | - | Example of returned value: 1.8.2 |
| kernel.maxfiles | Maximum number of opened files supported by OS. | Number of files. Integer. | ||
| kernel.maxproc | Maximum number of processes supported by OS. | Number of processes. Integer. |
||
| log[file,<regexp>,<encoding>,<maxlines>,<mode>] | Monitoring of log file. | Log. | file – full file name regexp – regular expression for pattern encoding - Code Page identifier maxlines - Maximum number of new lines per second the agent will send to Zabbix Server or Proxy. This parameter overrides the 'MaxLinesPerSecond' option in zabbix_agentd.conf mode - one of all (default), skip (skipping processing of older data) Parameter mode will be supported from version 2.0. |
Must be configured as an Active Check. Example: log[/home/zabbix/logs/logfile,,,100] See detailed description. |
| logrt[file_format,<regexp>,<encoding>,<maxlines>,<mode>] | Monitoring of log file with log rotation support. | Log. | file_format – full file name in format [absolute path][filename format as regexp] regexp – regular expression for pattern encoding - Code Page identifier maxlines - Maximum number of new lines per second the agent will send to Zabbix Server or Proxy. This parameter overrides the 'MaxLinesPerSecond' option in zabbix_agentd.conf mode - one of all (default), skip (skipping processing of older data) Parameter mode will be supported from version 2.0. |
Must be configured as an Active Check. Example: logrt["/home/zabbix/logs/^logfile[0-9]{1,3}$",,,100] Log rotation is based on last modification times of files. See detailed description. |
| eventlog[name,<regexp>,<severity>,<source>,<eventid>,<maxlines>,<mode>] | Monitoring of event logs. | Log. | name – event log name regexp – regular expression severity – regular expression The parameter accepts the following values: "Information", "Warning", "Error", "Failure Audit", "Success Audit" source - Source identifier eventid - regular expression maxlines - Maximum number of new lines per second the agent will send to Zabbix Server or Proxy. This parameter overrides the 'MaxLinesPerSecond' option in zabbix_agentd.conf mode - one of all (default), skip (skipping processing of older data) Parameter mode will be supported from version 2.0. |
Must be configured as an Active Check. Examples: eventlog[Application] eventlog[Security,,"Failure Audit",,529|680] eventlog[System,,"Warning|Error"] eventlog[System,,,,^1$] eventlog[System,,,,@TWOSHORT] - here custom regular expression TWOSHORT is defined as type Result is TRUE and expression itself is ^1$|^70$. |
| net.if.collisions[if] | Out-of-window collision. | Number of collisions. Integer. |
if - interface | |
| net.if.in[if,<mode>] | Network interface incoming statistic. | Integer. | if - interface mode – bytes number of bytes (default) packets number of packets errors number of errors dropped number of dropped packets |
Examples: net.if.in[eth0,errors] net.if.in[eth0] You may use this key with Delta (speed per second) in order to get bytes per second statistics. |
| net.if.list | List of network interfaces: Type Status IPv4 Description | String | Supported since Zabbix agent version 1.8.1. | |
| net.if.out[if,<mode>] | Network interface outgoing statistic. | Integer. | if - interface mode – bytes number of bytes (default) packets number of packets errors number of errors dropped number of dropped packets |
Examples: net.if.out[eth0,errors] net.if.out[eth0] You may use this key with Delta (speed per second) in order to get bytes per second statistics. |
| net.if.total[if,<mode>] | Sum of network interface incoming and outgoing statistics. | Integer. | if - interface mode – bytes number of bytes (default) packets number of packets errors number of errors dropped number of dropped packets |
Examples: net.if.total[eth0,errors] net.if.total[eth0] You may use this key with Delta (speed per second) in order to get bytes per second statistics. Note that dropped packets are supported only if both net.if.in and net.if.out work for dropped packets on your platform. |
| net.tcp.dns[<ip>,zone] | Checks if DNS service is up. | 0 - DNS is down 1 - DNS is up |
ip - IP address of DNS server (ignored) zone - zone to test the DNS |
Example: net.tcp.dns[127.0.0.1,zabbix.com] |
| net.tcp.dns.query[<ip>,zone,<type>] | Performs a query for the supplied DNS record type. | On success returns a character string with the required type of information. | ip - IP address of DNS server (ignored) zone - zone to test the DNS type - Record type to be queried (default is SOA) |
Example: net.tcp.dns.query[127.0.0.1,zabbix.com,MX] type can be one of: A, NS, CNAME, MB, MG, MR, PTR, MD, MF, MX, SOA, NULL, WKS, HINFO, MINFO, TXT |
| net.tcp.listen[port] | Checks if this TCP port is in LISTEN state. | 0 - it is not 1 - it is in LISTEN state |
port - TCP port number | Example: net.tcp.listen[80] On Linux supported since Zabbix agent version 1.8.4 |
| net.tcp.port[<ip>,port] | Check, if it is possible to make TCP connection to port number port. | 0 - cannot connect 1 - can connect |
ip - IP address(default is 127.0.0.1) port - port number |
Example: net.tcp.port[,80] can be used to test availability of WEB server running on port 80. Old naming: check_port[*] |
| net.tcp.service[service,<ip>,<port>] | Check if service is running and accepting TCP connections. | 0 - service is down 1 - service is running 2 - timeout connecting to the service |
service - one of ssh, ntp, ldap, smtp, ftp, http, pop, nntp, imap, tcp ip - IP address (default is 127.0.0.1) port - port number (by default standard service port number is used) |
Example: net.tcp.service[ftp,,45] can be used to test availability of FTP server on TCP port 45. Old naming: check_service[*] Note that before Zabbix version 1.8.3 service.ntp should be used instead of ntp. |
| net.tcp.service.perf[service,<ip>,<port>] | Check performance of service | 0 - service is down sec - number of seconds spent while connecting to the service |
service - one of ssh, ntp, ldap, smtp, ftp, http, pop, nntp, imap, tcp ip - IP address (default is 127.0.0.1) port - port number (by default standard service port number is used) |
Example: net.tcp.service.perf[ssh] can be used to test speed of initial response from SSH server. Old naming: check_service[*] Note that before Zabbix version 1.8.3 service.ntp should be used instead of ntp. |
| net.udp.listen[port] | Checks if this UDP port is in LISTEN state. | 0 - it is not 1 - it is in LISTEN state |
port - UDP port number | Example: net.udp.listen[68] On Linux supported since Zabbix agent version 1.8.4 |
| proc.mem[<name>,<user>,<mode>,<cmdline>] | Memory used by process name running under user user | Memory used by process. | name - process name user - user name (default is all users) mode - one of avg, max, min, sum (default) cmdline - filter by command line |
Example: proc.mem[,root] - memory used by all processes running under user "root". proc.mem[zabbix_server,zabbix] - memory used by all processes zabbix_server running under user zabbix proc.mem[,oracle,max,oracleZABBIX] - memory used by most memory hungry process running under oracle having oracleZABBIX in its command line |
| proc.num[<name>,<user>,<state>,<cmdline>] | Number of processes name having state running under user user | Number of processes. | name - process name user - user name (default is all users) state - one of all (default), run, sleep, zomb cmdline - filter by command line |
Example: proc.num[,mysql] - number of processes running under user mysql proc.num[apache2,www-data] - number of apache2 running under user www-data proc.num[,oracle,sleep,oracleZABBIX] - number of processes in sleep state running under oracle having oracleZABBIX in its command line On Windows, only name and user arguments are supported. |
| sensor[device,sensor,<mode>] | Hardware sensor reading. | device - device name (if mode is used, it is a regular expression) sensor - sensor name (if mode is used, it is a regular expression) mode - one of avg, max, min (if omitted, device and sensor are treated verbatim). |
On Linux 2.4, reads /proc/sys/dev/sensors. Example: sensor[w83781d-i2c-0-2d,temp1] Prior to Zabbix 1.8.4, format sensor[temp1] was used. On OpenBSD, reads hw.sensors MIB. Example: sensor[cpu0,temp0] - one temperature of one CPU sensor[cpu[0-2]$,temp,avg] - average temperature of the first three CPU's Supported on OpenBSD since Zabbix 1.8.4. |
|
| system.boottime | Timestamp of system boot. | Integer. | Time in seconds. | |
| system.cpu.intr | Device interrupts. | Integer. | ||
| system.cpu.load[<cpu>,<mode>] | CPU load. | Processor load. Float. |
cpu - CPU number (default is all CPUs) mode - one of avg1 (default),avg5 (average within 5 minutes), avg15 |
Example: system.cpu.load[] Old naming: system.cpu.loadX |
| system.cpu.num[<type>] | Number of CPUs. | Number of available processors. | type - one of online (default), max | Example: system.cpu.num |
| system.cpu.switches | Context switches. | Switches count. | Old naming: system[switches] | |
| system.cpu.util[<cpu>,<type>,<mode>] | CPU(s) utilisation. | Processor utilisation in percents | cpu - CPU number (default is all CPUs) type - one of idle, nice, user (default), system, kernel, iowait, interrupt, softirq, steal mode - one of avg1 (default),avg5 (average within 5 minutes), avg15 |
Old naming: system.cpu.idleX, system.cpu.niceX, system.cpu.systemX, system.cpu.userX Example: system.cpu.util[0,user,avg5] |
| system.hostname | Return host name. | String value | Example of returned value www.zabbix.com |
|
| system.localtime | System time. | Integer or string value. | utc - (default) the time since the Epoch (00:00:00 UTC, January 1, 1970), measured in seconds. local - the time in the 'yyyy-mm-dd,hh:mm:ss.nn,+hh:mm' format Parameters for this item will be supported from version 2.0. |
|
| system.run[command,<mode>] | Run specified command on the host. | Text result of the command | command - command for execution mode - one of wait (default, wait end of execution), nowait (do not wait) |
Example: system.run[ls -l /] - detailed file list of root directory. Note: To enable this functionality, agent configuration file must have EnableRemoteCommands=1 option. |
| system.stat[resource,<type>] | Virtual memory statistics | Numeric value | ent - number of processor units this partition is entitled to receive (float) kthr,<type> - information about kernel thread states: r - average number of runnable kernel threads (float) b - average number of kernel threads placed in the Virtual Memory Manager wait queue (float) memory,<type> - information about the usage of virtual and real memory: avm - active virtual pages (integer) fre - size of the free list (integer) page,<type> - information about page faults and paging activity: fi - file page-ins per second (float) fo - file page-outs per second (float) pi - pages paged in from paging space (float) po - pages paged out to paging space (float) fr - pages freed (page replacement) (float) sr - pages scanned by page-replacement algorithm (float) faults,<type> - trap and interrupt rate: in - device interrupts (float) sy - system calls (float) cs - kernel thread context switches (float) cpu,<type> - breakdown of percentage usage of processor time: us - user time (float) sy - system time (float) id - idle time (float) wa - idle time during which the system had outstanding disk/NFS I/O request(s) (float) pc - number of physical processors consumed (float) ec - the percentage of entitled capacity consumed (float) lbusy - indicates the percentage of logical processor(s) utilization that occurred while executing at the user and system level (float) app - indicates the available physical processors in the shared pool (float) disk,<type> - disk statistics: bps - indicates the amount of data transferred (read or written) to the drive in bytes per second (integer) tps - indicates the number of transfers per second that were issued to the physical disk/tape (float) This item is supported starting from version 1.8.1. |
|
| system.swap.in[<device>,<type>] | Swap in. | Swap statistics | device - swap device (default is all), type - one of count (default, number of swapins), sectors (sectors swapped in), pages (pages swapped in) | Example: system.swap.in[,pages] Old naming: swap[in] |
| system.swap.out[<device>,<type>] | Swap out. | Swap statistics | device - swap device (default is all), type - one of count (default, number of swapouts), sectors (sectors swapped out), pages (pages swapped out) | Example: system.swap.out[,pages] Old naming: swap[out] |
| system.swap.size[<device>,<mode>] | Swap space. | Number of bytes or percentage | device - swap device (default is all), type - one of free (default, free swap space), total (total swap space), pfree (free swap space, percentage), pused (used swap space, percentage) | Example: system.swap.size[,pfree] - percentage of free swap space Old naming: system.swap.free, system.swap.total |
| system.uname | Returns detailed host information. | String value | Example of returned value: FreeBSD localhost 4.4-RELEASE FreeBSD 4.4-RELEASE #0: Tue Sep 18 11:57:08 PDT 2001 [email protected]: /usr/src/sys/compile/GENERIC i386 |
|
| system.uptime | System's uptime in seconds. | Number of seconds | Use Units s or uptime to get readable values. | |
| system.users.num | Number of users connected. | Number of users | Command who is used on agent side. | |
| vfs.dev.read[device,<type>] | Disk read statistics. | Numeric value | device - disk device (default is all) type - one of sectors, operations, bytes, sps, ops, bps (must specify exactly which parameter to use, since defaults are different under various OSes) |
Example: vfs.dev.read[,operations] Old naming: io[*] On Linux and FreeBSD vfs.dev.read[<device>, ops/bps/sps] is limited to 8 devices (7 individual devices and one "all" device) |
| vfs.dev.write[device,<type>] | Disk write statistics. | Numeric value | device - disk device (default is all) type - one of sectors, operations, bytes, sps, ops, bps (must specify exactly which parameter to use, since defaults are different under various OSes) |
Example: vfs.dev.write[,operations] Old naming: io[*] On Linux and FreeBSD vfs.dev.write[<device>, ops/bps/sps] is limited to 8 devices (7 individual devices and one "all" device) |
| vfs.file.cksum[file] | Calculate file check sum | File check sum calculated by algorithm used by UNIX cksum. | file - full path to file | Example of returned value: 1938292000 Example: vfs.file.cksum[/etc/passwd] |
| vfs.file.contents[file,<encoding>] | Get file contents | Text. | file - full path to file | Example: vfs.file.contents[/etc/passwd] This item is limited to files no larger than 64 Kbytes. Supported since Zabbix agent version 2.0. |
| vfs.file.exists[file] | Check if file exists | 0 - file does not exist 1 - file exists | file - full path to file | Example: vfs.file.exists[/tmp/application.pid] |
| vfs.file.md5sum[file] | File's MD5 check sum | MD5 hash of the file. Can be used only for files less than 64MB, unsupported otherwise. | Example of returned value: b5052decb577e0fffd622d6ddc017e82 Example: vfs.file.md5sum[/etc/zabbix/zabbix_agentd.conf] |
|
| vfs.file.regexp[file,regexp,<encoding>] | Find string in a file | Matched string or EOF if expression not found | file - full path to file, regexp - GNU regular expression encoding - Code Page identifier |
Example: vfs.file.regexp[/etc/passwd,zabbix] |
| vfs.file.regmatch[file,regexp,<encoding>] | Find string in a file | 0 - expression not found 1 - found | file - full path to file regexp - GNU regular expression encoding - Code Page identifier |
Example: vfs.file.regmatch[/var/log/app.log,error] |
| vfs.file.size[file] | File size | Size in bytes. | file - full path to file | File must have read permissions for user zabbix Example: vfs.file.size[/var/log/syslog] |
| vfs.file.time[file,<mode>] | File time information. | Number of seconds. | file - full path to file mode - one of modify (default, modification time), access - last access time, change - last change time |
Example: vfs.file.time[/etc/passwd,modify] |
| vfs.fs.inode[fs,<mode>] | Number of inodes | Numeric value | fs - filesystem mode - one of total (default), free, used, pfree (free, percentage), pused (used, percentage) |
Example: vfs.fs.inode[/,pfree] Old naming: vfs.fs.inode.free[*], vfs.fs.inode.pfree[*], vfs.fs.inode.total[*] |
| vfs.fs.size[fs,<mode>] | Disk space | Disk space in bytes | fs - filesystem mode - one of total (default), free, used, pfree (free, percentage), pused (used, percentage) |
In case of a mounted volume, disk space for local file system is returned. Example: vfs.fs.size[/tmp,free] Old naming: vfs.fs.free[*], vfs.fs.total[*], vfs.fs.used[*], vfs.fs.pfree[*], vfs.fs.pused[*] |
| vm.memory.size[<mode>] | Memory size | Memory size in bytes | mode - one of total (default), shared, free, buffers, cached, pfree, available | Old naming: vm.memory.buffers, vm.memory.cached, vm.memory.free, vm.memory.shared, vm.memory.total |
| web.page.get[host,<path>,<port>] | Get content of WEB page | WEB page source as text | host - hostname path - path to HTML document (default is /) port - port number (default is 80) |
Returns EOF on fail. Example: web.page.get[www.zabbix.com,index.php,80] |
| web.page.perf[host,<path>,<port>] | Get timing of loading full WEB page | Time in seconds | host - hostname path - path to HTML document (default is /) port - port number (default is 80) |
Returns 0 on fail. Example: web.page.perf[www.zabbix.com,index.php,80] |
| web.page.regexp[host,<path>,<port>,<regexp>,<length>] | Get first occurrence of regexp in WEB page | Matched string | host - hostname path - path to HTML document (default is /) port - port number (default is 80) regexp - GNU regular expression length - maximum number of characters to return |
Returns EOF on fail (no match). Example: web.page.regexp[www.zabbix.com,index.php,80,OK,2] |
Linux-specific note. Zabbix agent must have read-only access to filesystem /proc. Kernel patches from www.grsecurity.org limit access rights of non-privileged users.
WIN32-specific parameters
This section contains description of parameter supported by Zabbix WIN32 agent only.
| Key | Description | Return value | Comments |
|---|---|---|---|
| perf_counter[counter,<interval>] | Value of any performance counter, where "counter" is the counter path, and "interval" is the time period for storing the average value. | Average value of the "counter" during last "interval" seconds. Default value, if not given, for "interval" is 1. | Performance Monitor can be used to obtain list of available counters. Until version 1.6 this parameter will return correct value only for counters that require just one sample (like \System\Threads). It will not work as expected for counters that require more that one sample - like CPU utilisation. Since 1.6 interval is used, so the check returns an average value for last "interval" seconds every time. |
| service_state[*] | State of service. Parameter is service name. | 0 – running 1 – paused 2 - start pending 3 - pause pending 4 - continue pending 5 - stop pending 6 – stopped 7 - unknown 255 – no such service |
Parameter must be real service name as seen in service properties under "Name:" or name of EXE file. |
| services[<type>,<state>,<exclude>] | List of services, separated by a newline or 0, if list would be empty. | type - one of all (default), automatic, manual, disabled state - one of all (default), stopped, started, start_pending, stop_pending, running, continue_pending, pause_pending, paused exclude - list of services to exclude it from the result. Excluded services should be written in double quotes, separated by comma, without spaces. This parameter is supported starting from version 1.8.1. |
Examples: services[,started] - list of started services services[automatic, stopped] - list of stopped services, that should be run services[automatic, stopped, "service1,service2,service3"] -list of stopped services, that should be run, excluding services with names service1,service2 and service3 |
| proc_info[<process>,<attribute>,<type>] | Different information about specific process(es). | <process> - process name (same as in proc_cnt[] parameter) <attribute> - requested process attribute. |
The following attributes are currenty supported: vmsize - Size of process virtual memory in Kbytes wkset - Size of process working set (amount of physical memory used by process) in Kbytes pf - Number of page faults ktime - Process kernel time in milliseconds utime - Process user time in milliseconds io_read_b - Number of bytes read by process during I/O operations io_read_op - Number of read operation performed by process io_write_b - Number of bytes written by process during I/O operations io_write_op - Number of write operation performed by process io_other_b - Number of bytes transferred by process during operations other than read and write operations io_other_op - Number of I/O operations performed by process, other than read and write operations gdiobj - Number of GDI objects used by process userobj - Number of USER objects used by process <type> - representation type (meaningful when more than one process with the same name exists). Valid values are: min - minimal value among all processes named <process> max - maximal value among all processes named <process> avg - average value for all processes named <process> sum - sum of values for all processes named <process> Examples: 1. In order to get the amount of physical memory taken by all Internet Explorer processes, use the following parameter: proc_info[iexplore.exe,wkset,sum] 2. In order to get the average number of page faults for Internet Explorer processes, use the following parameter: proc_info[iexplore.exe,pf,avg] Note: All io_xxx,gdiobj and userobj attributes available only on Windows 2000 and later versions of Windows, not on Windows NT 4.0. |
19.5 SNMP Agent
Zabbix must be configured with SNMP support in order to be able to retrieve data provided by SNMP agents.
If monitoring SNMPv3 devices, make sure that msgAuthoritativeEngineID (also known as snmpEngineID or "Engine ID") is never shared by two devices. It must be unique for each device.
For SNMPv3 privacy and authentication currently MD5 and DES protocols are supported.
The following steps have to be performed in order to add monitoring of SNMP parameters:
Step 1
Create a host for the SNMP device.
Enter an IP address and a port of 161. Set the host Status to NOT MONITORED. You can use the host.SNMP template which would automatically add set of items. However, the template may not be compatible with the host.
Step 2
Find out the SNMP string of the item you want to monitor.
After creating the host, use 'snmpwalk' (part of ucd-snmp/net-snmp software which you should have installed as part of the Zabbix installation) or equivalent tool:
This will give you a list of SNMP strings and their last value. If it doesn't then it is possible that the SNMP 'community' is different from the standard public in which case you will need to find out what it is. You would then go through the list until you find the string you want to monitor, e.g. you wanted to monitor the bytes coming in to your switch on port 3 you would use:
You should now use the snmpget command to find the OID for interfaces.ifTable.ifEntry.ifInOctets.3:
where the last number in the string is the port number you are looking to monitor. This should give you something like the following:
again the last number in the OID is the port number.
3COM seem to use port numbers in the hundreds, e.g. port 1=port 101, port 3=port 103, but Cisco use regular numbers, e.g. port 3=3.
Step 3
Create an item for monitoring.
So, now go back to Zabbix and click on Items, selecting the SNMP host you created earlier. Depending on whether you used a template or not when creating your host you will have either a list of SNMP items associated with your host or just a new item box. We will work on the assumption that you are going to create the item yourself using the information you have just gathered using snmpwalk and snmpget, so enter a plain English description in the 'Description' field of the new item box. Make sure the 'Host' field has your switch/router in it and change the 'Type' field to "SNMPv1 agent". Enter the community (usually public) and enter the numeric OID that you retrieved earlier in to the 'SNMP OID' field being sure to include the leading dot, i.e. .1.3.6.1.2.1.2.2.1.10.3
Enter the 'SNMP port' as 161 and the 'Key' as something meaningful, e.g. SNMP-InOctets-Bps. Choose the Multiplier if you want one and enter an 'update interval' and 'keep history' if you want it to be different from the default. Set the 'Status' to Monitored, the 'Type of information' to Numeric (float) and the 'Store value' to DELTA (important otherwise you will get cumulative values from the SNMP device instead of the latest change).
Now save the item and go back to the hosts area of Zabbix. From here set the SNMP device to be Monitored and check in Latest data for your SNMP data!
Example 1
General example
| Parameter | Description |
|---|---|
| Community | public |
| Oid | 1.2.3.45.6.7.8.0 (or .1.2.3.45.6.7.8.0) |
| Key | <Unique string to be used as reference to triggers> For example, ‘my_param’. |
Note that OID can be given in either numeric or string form. However, in some cases, string OID must be converted to numeric representation. Utility snmpget may be used for this purpose:
Monitoring of SNMP parameters is possible if either -with-net-snmp or -with-ucd-snmp flag was specified while configuring Zabbix sources.
Example 2
Monitoring of Uptime
| Parameter | Description |
|---|---|
| Community | public |
| Oid | MIB::sysUpTime.0 |
| Key | router.uptime |
| Value type | Float |
| Units | uptime |
| Multiplier | 0.01 |
19.6 Simple checks
Simple checks are normally used for agent-less monitoring or for remote checks of services. Note that Zabbix agent is not needed for simple checks. Zabbix server is responsible for processing of simple checks (making external connections, etc).
All simple checks, except tcp and tcp_perf, accept one optional parameter:
- port - port number. If missing, standard default service port is used.
Examples of using simple checks:
IP is taken from the Zabbix host definition.
Checking of encrypted protocols (like IMAP on port 993 or POP on port 995) is currently not supported. As a workaround, please use tcp and tcp_perf for checks like these.
List of supported simple checks:
| Key | Description | Return value |
|---|---|---|
| ftp,<port> | Checks if FTP server is running and accepting connections | 0 – FTP server is down 1 – FTP server is running 2 – timeout |
| ftp_perf,<port> | Checks if FTP server is running and accepting connections | 0 – FTP server is down Otherwise, number of seconds spent connecting to FTP server. |
| http,<port> | Checks if HTTP server is running and accepting connections | 0 – HTTP server is down 1 – HTTP server is running 2 – timeout |
| http_perf,<port> | Checks if HTTP (WEB) server is running and accepting connections | 0 – HTTP (WEB) server is down Otherwise, number of seconds spent connecting to HTTP server. |
| icmpping[<target>,<packets>,<interval>,<size>,<timeout>] | Checks if server is accessible by ICMP ping target - host IP or DNS name packets - number of packets interval - time between successive packets in milliseconds size - packet size in bytes timeout - timeout in milliseconds |
0 – ICMP ping fails 1 – ICMP ping successful |
| icmppingloss[<target>,<packets>,<interval>,<size>,<timeout>] | Return percentage of lost packets target - host IP or DNS name packets - number of packets interval - time between successive packets in milliseconds size - packet size in bytes timeout - timeout in milliseconds |
Loss of packets in percents |
| icmppingsec[<target>,<packets>,<interval>,<size>,<timeout>,<mode>] | Return ICMP ping response time target - host IP or DNS name packets - number of packets interval - time between successive packets in milliseconds size - packet size in bytes timeout - timeout in milliseconds mode - one of min, max, avg (default) |
Number of seconds |
| imap,<port> | Checks if IMAP server is running and accepting connections | 0 – IMAP server is down 1 – IMAP server is running 2 – timeout |
| imap_perf,<port> | Checks if IMAP server is running and accepting connections | 0 – IMAP server is down Otherwise, number of seconds spent connecting to IMAP server. |
| ldap,<port> | Checks if LDAP server is running and accepting connections | 0 – LDAP server is down 1 – LDAP server is running 2 – timeout |
| ldap_perf,<port> | Checks if LDAP server is running and accepting connections | 0 – LDAP server is down Otherwise, number of seconds spent connecting to LDAP server. |
| nntp,<port> | Checks if NNTP server is running and accepting connections | 0 – NNTP server is down 1 – NNTP server is running 2 – timeout |
| nntp_perf,<port> | Checks if NNTP server is running and accepting connections | 0 – NNTP server is down Otherwise, number of seconds spent connecting to NNTP server. |
| ntp,<port> | Checks if NTP server is running and accepting connections | 0 – NTP server is down 1 – NTP server is running 2 – timeout |
| ntp_perf,<port> | Checks if NTP server is running and accepting connections | 0 – NTP server is down Otherwise, number of seconds spent connecting to NTP server. |
| pop,<port> | Checks if POP server is running and accepting connections | 0 – POP server is down 1 – POP server is running 2 – timeout |
| pop_perf,<port> | Checks if POP server is running and accepting connections | 0 – POP server is down Otherwise, number of seconds spent connecting to POP server. |
| smtp,<port> | Checks if SMTP server is running and accepting connections | 0 – SMTP server is down 1 – SMTP server is running 2 – timeout |
| smtp_perf,<port> | Checks if SMTP server is running and accepting connections | 0 – SMTP server is down Otherwise, number of seconds spent connecting to SMTP server. |
| ssh,<port> | Checks if SSH server is running and accepting connections | 0 – SSH server is down 1 – SSH server is running 2 – timeout |
| ssh_perf,<port> | Checks if SSH server is running and accepting connections | 0 – SSH server is down Otherwise, number of seconds spent connecting to SSH server. |
| tcp,port | Checks if TCP service is running and accepting connections | 0 – TCP service is down 1 – TCP service is running 2 – timeout |
| tcp_perf,port | Checks if TCP service is running and accepting connections | 0 - the service on the port is down Otherwise, number of seconds spent connecting to the TCP service. |
Timeout processing
Zabbix will not process a simple check longer than Timeout seconds defined in Zabbix server configuration file.
In case if Timeout time is exceeded, 2 is returned.
ICMP pings
Zabbix uses external utility fping for processing of ICMP pings. The utility is not part of Zabbix distribution and has to be additionally installed. If the utility is missing, has wrong permissions or its location does not match FpingLocation defined in configuration file, ICMP pings (icmpping, icmppingsec and icmppingloss) will not be processed.
Run these commands as user root in order to setup correct permissions:
shell> chown root:zabbix /usr/sbin/fping
       shell> chmod 710 /usr/sbin/fping
       shell> chmod ug+s /usr/sbin/fping
The default values for ICMP checks parameters:
| Parameter | Value | Description | fping flag | Min | Max |
|---|---|---|---|---|---|
| packets | 3 | pings to the target | -c | 1 | 10000 |
| interval | 25 | milliseconds, "fping" default | -p | 20 | |
| size | 56 or 68 | bytes, "fping" default; 56 bytes on x86, 68 bytes on x86_64 | -b | 24 | 65507 |
| timeout | 500 | milliseconds, "fping" default | -t | 50 | |
Warning: fping defaults can differ depending on platform and version - if in doubt, check fping documentation.
Zabbix writes addresses to be checked to a temporary file, which is then passed to fping. If items have different parameters, only ones with identical parameters are written to a single file.
19.7 Internal checks
Internal checks allow monitoring of internals of Zabbix. Internal checks are calculated by Zabbix Server.
| Key | Description | Comments | ||
|---|---|---|---|---|
| zabbix[boottime] | Startup time of Zabbix server process in seconds. | Unix timestamp. | ||
| zabbix[history] | Number of values stored in table HISTORY | Do not use if MySQL InnoDB, Oracle or PostgreSQL is used! | ||
| zabbix[history_log] | Number of values stored in table HISTORY_LOG | Do not use if MySQL InnoDB, Oracle or PostgreSQL is used! This item is supported starting from version 1.8.3. |
||
| zabbix[history_str] | Number of values stored in table HISTORY_STR | Do not use if MySQL InnoDB, Oracle or PostgreSQL is used! | ||
| zabbix[history_text] | Number of values stored in table HISTORY_TEXT | Do not use if MySQL InnoDB, Oracle or PostgreSQL is used! This item is supported starting from version 1.8.3. |
||
| zabbix[history_uint] | Number of values stored in table HISTORY_UINT | Do not use if MySQL InnoDB, Oracle or PostgreSQL is used! This item is supported starting from version 1.8.3. |
||
| zabbix[items] | Number of items in Zabbix database | |||
| zabbix[items_unsupported] | Number of unsupported items in Zabbix database | |||
| zabbix[log] | Stores warning and error messages generated by Zabbix server. | Character. Add item with this key to have Zabbix internal messages stored. | ||
| zabbix[proxy,<name>,<param>] | Access to Proxy related information. | <name> - Proxy name List of supported parameters (<param>): lastaccess – timestamp of last heart beat message received from Proxy For example, zabbix[proxy,"Germany",lastaccess] Trigger function fuzzytime() can be used to check availability of proxies. |
||
| zabbix[queue,<from>,<to>] | Number of server monitored items in the Queue which are delayed by <from> to <to> seconds, inclusive. | <from> - default: 6 seconds <to> - default: infinity Suffixes s,m,h,d,w are supported for these parameters. Parameters from and to are supported starting from version 1.8.3. |
||
| zabbix[trends] | Number of values stored in table TRENDS | Do not use if MySQL InnoDB, Oracle or PostgreSQL is used! | ||
| zabbix[trends_uint] | Number of values stored in table TRENDS_UINT | Do not use if MySQL InnoDB, Oracle or PostgreSQL is used! This item is supported starting from version 1.8.3. |
||
| zabbix[triggers] | Number of triggers in Zabbix database | |||
| zabbix[uptime] | Uptime of Zabbix server process in seconds. | |||
| zabbix[wcache,<cache>,<mode>] | Cache | Mode | ||
| values | all | Number of values processed by Zabbix server. | It is the best indicator of Zabbix performance. | |
| float | ||||
| uint | ||||
| str | ||||
| log | ||||
| text | ||||
| history | pfree | Free space in the history buffer in percentage. | Low number indicates performance problems on the database side. | |
| total | ||||
| used | ||||
| free | ||||
| trend | pfree | |||
| total | ||||
| used | ||||
| free | ||||
| text | pfree | |||
| total | ||||
| used | ||||
| free | ||||
| zabbix[rcache,<cache>,<mode>] | Cache | Mode | ||
| buffer | pfree | |||
| total | ||||
| used | ||||
| free | ||||
19.8 Aggregated checks
Aggregate checks do not require any agent running on a host being monitored. Zabbix server collects aggregate information by doing direct database queries.
Syntax of aggregate item's key
Supported group functions:
| GROUP FUNCTION | DESCRIPTION |
|---|---|
| grpavg | Average value |
| grpmax | Maximum value |
| grpmin | Minimum value |
| grpsum | Sum of values |
Supported item functions:
| ITEM FUNCTION | DESCRIPTION |
|---|---|
| avg | Average value |
| count | Number of values |
| last | Last value |
| max | Maximum value |
| min | Minimum value |
| sum | Sum of values |
Examples of keys for aggregate items:
Example 1
Total disk space of host group 'MySQL Servers'.
Example 2
Average processor load of host group 'MySQL Servers'.
Example 3
Average (5min) number of queries per second for host group 'MySQL Servers'
19.9 External checks
External check is a check executed by Zabbix Server by running a shell script or a binary.
External checks do not require any agent running on a host being monitored.
Syntax of item's key:
If you don't want to pass your parameters to the script you may use:
Zabbix server will find and execute the command in directory defined in configuration parameter ExternalScripts in zabbix_server.conf. Command will be executed as the user Zabbix server runs as, so any access permissions or environment variables should be handled in a wrapper script, if necessary, and permissions on the command should allow that user to execute it. Only commands in the specified directory are available.
This directory is located on Zabbix server. For custom command execution using Zabbix agents see user parameter documentation.
First command line parameter is host name, other parameters are substituted by parameters.
Zabbix uses the standard output of the script as the value. Standard error and exit code are discarded.
Do not overuse external checks! It can decrease performance of Zabbix system a lot.
Example 1
Execute script check_oracle.sh with parameters "-h 192.168.1.4". Host name 'www1.company.com'.
Zabbix will execute:
19.10 SSH checks
Zabbix must be configured with SSH2 support. ::: noteimportant The minimal supported libssh2 library version is 1.0.0. :::
SSH checks are used for agent-less monitoring. Note that Zabbix agent is not needed for SSH checks.
Actual commands to be executed must be placed in the Executed script field in the item configuration. Multiple commands can be executed one after another by placing them on a new line.
| Key | Description | Comments |
|---|---|---|
| ssh.run[<unique short description>,<ip>,<port>,<encoding>] | Run a command by using SSH remote session | |
19.11 Telnet checks
Telnet checks are used for agent-less monitoring. Zabbix agent is not needed for Telnet checks.
Actual commands to be executed must be placed in the Executed script field in the item configuration. Multiple commands can be executed one after another by placing them on a new line.
Till version 1.8.1, supported characters that prompt the prompt can end with:
- $
- #
Zabbix version 1.8.2 adds support for additional character:
- %
| Key | Description | Comments |
|---|---|---|
| telnet.run[<unique short description>,<ip>,<port>,<encoding>] | Run a command on a remote device using telnet connection | |
19.12 Calculated items
Support of calculated items was introduced in Zabbix 1.8.1
Calculated items is a very nice way of creating virtual data sources. Item values will be periodically calculated based on a arithmetical expression.
Resulting data will be stored in Zabbix database as for any other item - this means storing both history and trends values for fast graph generation.
To use calculated items, choose item type Calculated. You can create any key name using supported symbols. Calculation definition should be entered in the Formula field (named Expression in 1.8.1 and 1.8.2). Key is a unique identifier (per host), using allowed symbols.
All items that are referenced from the calculated item formula must be created and collecting data.
A very simple expression might look like:
More complex expression may use a combination of functions, operators and brackets. You could use all functions and operators supported in trigger expressions. Note that syntax is slightly different, however logic and operator precedence are exactly the same.
| ARGUMENT | DEFINITION |
|---|---|
| func | One of functions supported by trigger expressions: last, min, max, avg, count, etc |
| host:key | Is a reference to an item. It may be defined as key or hostname:key |
| parameter(s) | Optional parameters |
Supported characters for a hostname:
Supported characters for a key:
Supported characters for a function:
Unlike trigger expressions, Zabbix processes calculated items according to item update interval, not upon receiving a new value. Also if you change item key of a referenced item, you have to update all formulas that used the old key manually.
A calculated item may become unsupported in several cases:
- referenced item(s) not found
- no data to calculate a function
- division by zero
- syntax errors
Example 1
Calculate percentage of free disk space on '/'.
Use of function last:
Zabbix will take the latest values for free and total disk spaces and calculate percentage according to the given formula.
Example 2
Calculate 10 minute average number of values processed by Zabbix.
Use of function avg:
Note that extensive use of calculated items with long time periods may affect performance of Zabbix Server.
Example 3
Calculate total bandwidth on eth0.
Sum of two functions:
Example 4
Calculate percentage of incoming traffic.
More complex expression: