

Table of Contents
13 Screens and Slide Shows
Zabbix screens allow grouping of various information for quick access and display on one screen. An easy-to-use screen builder makes creating screens easy and intuitive.
A screen is a table which may contain the following elements in each cell:
- simple graphs
- user-defined graphs
- maps
- other screens
- plain text information
- server information (overview)
- trigger information (overview)
- data overview
- clock
- history of events
- history of actions
- URL (data taken from other location)
The number of elements per screen is unlimited.
You can configure screens in Configuration → Screens and view them in Monitoring → Screens as well as include your favourite screens in the favourites section of Monitoring → Dashboard.
If graph height is set as less than 120 pixels, no trigger will be displayed in the legend.
A slide show is a series of screens, which will be automatically rotated according to configured update intervals.
You can configure slide shows in Configuration → Slides.
| PARAMETER | Description |
|---|---|
| Name | Name of slide show. |
| Update interval (in sec) | This parameter defines the default interval between screen rotation, in seconds. |
| Slides | List of individual slides (screens) |
| Screen | Screen name |
| Delay | How long the screen will be displayed, in seconds. If set to 0, Update Interval of the slide show will be used. |
Example 1
Slide show "Zabbix administrators"
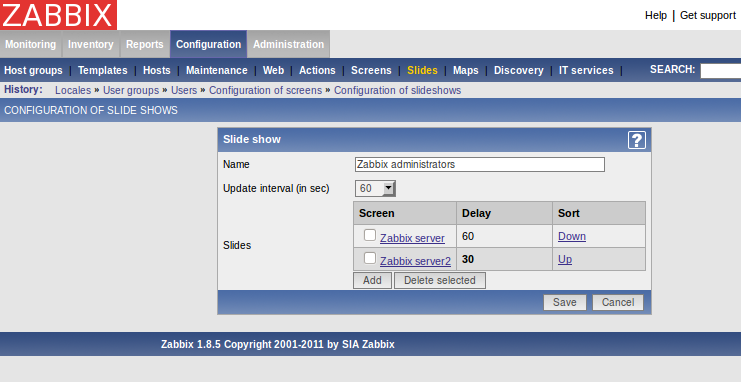
The slide show consists of two screens which will be displayed in the following order:
Zabbix Server ⇒ Pause 60 seconds ⇒ Zabbix Server2 ⇒ Pause 30 seconds ⇒ Zabbix Server ⇒ Pause 60 seconds ⇒ Zabbix Server2 ⇒ ...