

Table of Contents
- 5 What's new in Zabbix 2.2.0
- 5.1 Improved web monitoring
- 5.2 Virtual machine monitoring
- 5.3 Support for IPMI discrete sensors
- 5.4 Loadable modules
- 5.5 Referencing item values in graph names
- 5.6 Notifications on unsupported items, unknown triggers
- 5.7 Value mapping for string and float type data
- 5.8 Trigger length limit increased
- 5.9 Some trigger function parameters can be empty
- 5.10 Network map improvements
- 5.11 Finer control over housekeeping tasks
- 5.12 Permission improvements
- 5.13 Linking templates with the same application name
- 5.14 Accessible history data for disabled hosts
- 5.15 Changed maintenance period logic
- 5.16 SNMPv3 monitoring
- 5.17 Ability to extract matching part of a regular expression
- 5.18 Support of internal checks for proxies
- 5.19 Templates
- 5.20 Network discovery changes
- 5.21 Items
- 5.22 Trigger functions
- 5.23 Macros
- 5.24 Frontend improvements
- 5.24.1 Improved layout
- 5.24.2 Latest data section
- 5.24.3 Configuration options and monitoring data accessible from host inventory
- 5.24.4 More flexible dashboard filter
- 5.24.5 Displaying name and surname with acknowledgements
- 5.24.6 Ability to view acknowledgements in trigger status page
- 5.24.7 Overview filtered by application
- 5.24.8 Ability to append host groups, item applications on mass update
- 5.24.9 Screen element changes
- 5.24.10 Hierarchy in global scripts
- 5.24.11 Editable discovery checks
- 5.24.12 Improved host, template, host group selection
- 5.24.13 Multi-selection of values in action conditions
- 5.24.14 Improved global search page
- 5.24.15 Miscellaneous improvements
- 5.24.16 Antialiasing in generated graphics
- 5.25 Daemon improvements
- 5.25.1 Automatic database upgrade
- 5.25.2 Zabbix proxy improvements
- 5.25.3 Support for long and string SNMP indexes
- 5.25.4 Value cache for faster access to history data
- 5.25.5 Reducing update operations in item table
- 5.25.6 Improved work with configuration and history caches
- 5.25.7 Multiple timer processes
- 5.25.8 Logging the used configuration file name
- 5.25.9 JSON validation on server
- 5.25.10 Host metadata for host auto-registration
- 5.25.11 Dynamic display of current process activity and statistics
- 5.25.12 Miscellaneous daemon improvements
- 5.26 API improvements
- 5.27 Miscellaneous
5 What's new in Zabbix 2.2.0
5.1 Improved web monitoring
5.1.1 Templated web scenarios
Web scenarios previously could not be template members so it used to be quite difficult to apply some scenario to multiple hosts.
Starting with Zabbix 2.2.0 web scenarios can be template members in the same way as items, triggers, graphs, screens and low level discovery rules. If a template is applied to several hosts, all hosts will inherit the web scenarios in the template.
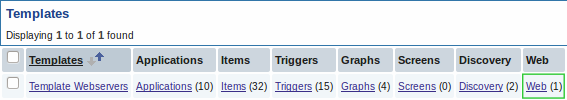
In the frontend, web scenarios are now created in Configuration → Templates and Configuration → Hosts respectively, similarly to the way items, triggers etc. are created. A separate Configuration → Web menu exists no more.
5.1.2 New configuration parameters
The web scenario configuration form has gained new parameters.
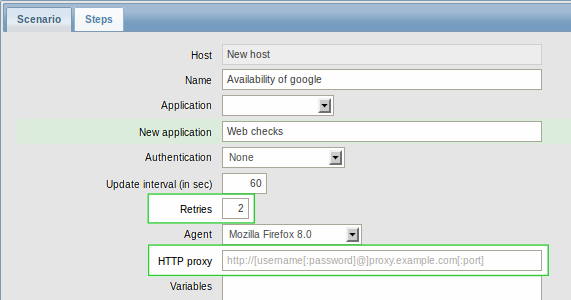
Retries of web scenario steps
A new Retries parameter is introduced, allowing to set the number of attempts for executing web scenario steps in case of timeouts and network-related issues.
Use of HTTP proxy
The use of an HTTP proxy can now be specified directly in the web scenario configuration form.
5.1.3 More options with variables
Regular expression matching
In addition to the standard variable syntax of {variable}=value now there is also support for a {variable}=regex:<regular expression> syntax for finding matches on a web page to a regular expression. The regex: string indicates that what follows is treated as a regular expression.
For example,
is looking for a "//hostid is //" string and then will extract any number that follows this string and store it in the variable.
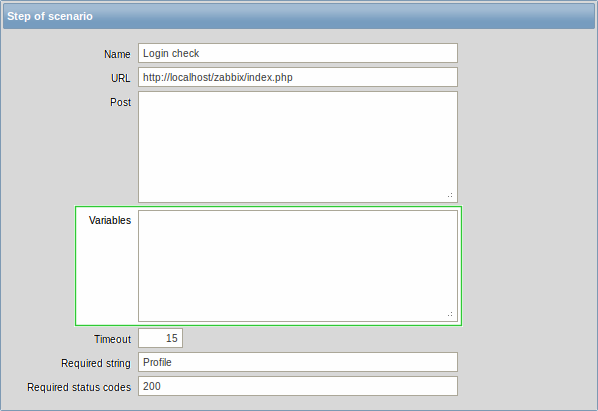
Variables on step level
Variables can now be defined not only on a scenario level, but on a step level as well. A step-level variable overrides a scenario-level variable or the variables of the previous step.
5.1.4 Improved error logging
Previously, when server or proxy performed web monitoring and there was a failure, it only mentioned scenario and step names, for example:
With templated web monitoring the need to know which host had the problem is bigger, and thus the messages now include that information as well:
Additionally, more error messages will be printed at debug level 3.
5.2 Virtual machine monitoring
A new feature in Zabbix 2.2.0 is VMware virtual machine monitoring. It allows to monitor VMware vCenter and vSphere installations for various VMware hypervisor and virtual machine properties and statistics.
Zabbix can use low-level discovery rules to automatically discover VMware hypervisors and virtual machines and create hosts to monitor them, based on pre-defined host prototypes. See Virtual machine monitoring for more detailed information.
5.3 Support for IPMI discrete sensors
Previously Zabbix supported reading only IPMI threshold (analog) sensors. Zabbix 2.2.0 adds reading states of IPMI discrete sensors. A new function band() (bitwise AND) and an improved function count() can be used for testing state of bits of discrete sensors.
5.4 Loadable modules
Loadable modules, new in Zabbix 2.2, offer a way of extending Zabbix functionality that is more performance-minded than the user parameter option or external checks. In addition to greater performance and the ability to implement any logic, modules have the potential to be developed and shared within the Zabbix community.
Supported for Unix-like systems, a loadable module is basically a shared library used by Zabbix server, proxy or agent and loaded on startup. To deal with the modules, Zabbix server, proxy and agent support two new configuration parameters: LoadModulePath and LoadModule. The modules must be located in a directory specified by LoadModulePath. It is allowed to include multiple LoadModule parameters.
A sample module written in C is included in Zabbix 2.2 under src/modules/dummy. It can be used as a template for your own modules. To learn more about the loadable module option, visit the respective documentation section.
5.5 Referencing item values in graph names
Referencing item values in graph names is made possible starting with Zabbix 2.2 by using the standard {host:key.func(param)} macro syntax.
Similarly to map labels, only avg(), last(), max() and min() functions with seconds as parameter are supported within this macro in graph names. Value mapping is supported as well.
Additionally, LLD macros are supported in the parameters of an item key, making it possible to use a macro like {Cisco switch:ifAlias[{#SNMPINDEX}].last()}
{HOST.HOST<1-9>} macro can be used to reference a host: {{HOST.HOST}:ifAlias[{#SNMPINDEX}].last()}. As the graph may contain items from several hosts, {HOST.HOST} and {HOST.HOST1} will refer to the first host, {HOST.HOST2} to the second and so on.
5.6 Notifications on unsupported items, unknown triggers
In previous Zabbix versions it was not possible to be notified on unsupported items. If some item turned unsupported (and stopped gathering data) it could stay unnoticed for a long period of time. The only way of spotting an unsupported item was to look at the list of items all the time, which was rather impractical.
Starting with Zabbix 2.2 a new concept of internal events is introduced. Internal events happen not only when items become unsupported, but also when a low-level discovery rule becomes unsupported or a trigger goes into an unknown state.
The benefit of having internal events is that users can configure actions based on these events, similarly to actions based on trigger events, and receive notifications for unsupported items (unsupported LLD rules, unknown triggers). For more information, see a how-to section for configuring notifications on unsupported items.
5.7 Value mapping for string and float type data
Value mapping in Zabbix 2.0 was available for numeric integer data types only. In 2.2.0, full support for character and numeric float types has been implemented. For example, a backup related value map could be:
- F → Full
- D → Differential
- I → Incremental
In Monitoring → Latest data, displayed values are shortened to 20 symbols. If value mapping is used, this shortening is not applied to the mapped value, but only to the raw value separately (displayed in parenthesis).
Note that value mapping is not available for text or log data types.
5.8 Trigger length limit increased
Maximum length limit for trigger expressions was increased from 255 to 2048. Note that this is the "raw" limit, actual expression string may be notably longer in most cases.
5.9 Some trigger function parameters can be empty
A more friendly trigger expression parser allows to omit optional parameters in trigger functions. For example, trigger function "last(#1)" can be written as "last()", "last(#1,1h)" - as "last(,1h)".
It also works for functions of calculated items.
5.10 Network map improvements
5.10.1 Filtering trigger severity in maps
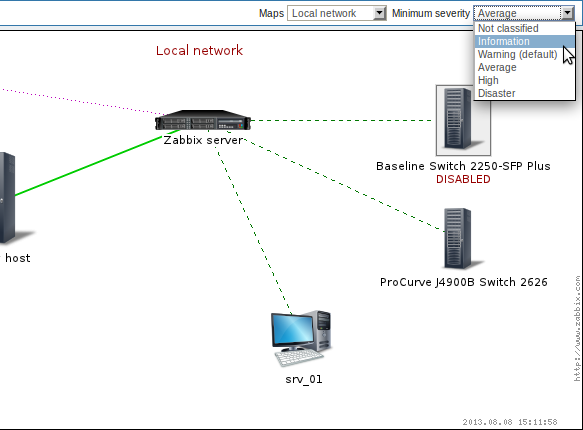
Map configuration has gained the option of defining the lowest trigger severity. This way only triggers on the defined level and above will be displayed in the map, and triggers below the defined severity will not be displayed.
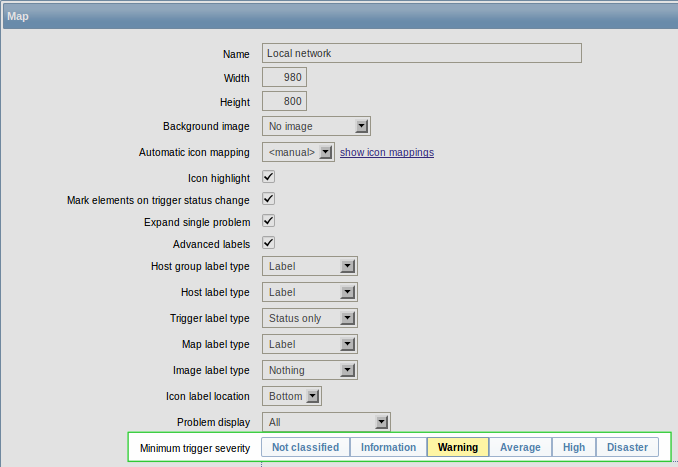
For example, only triggers starting with the Warning level can be displayed. Information and Not classified level triggers will not be reflected in the map.
The level selected in map configuration can be optionally overwritten when viewing maps in Monitoring → Maps:
5.10.2 Map label length limit increased
Maximum length limit for map element labels and link labels was increased from 255 to 2048.
5.10.3 Icons in map element properties now sorted
Previously, when configuring a map element, icons were listed in the order in which they had been created. Now they will be sorted alphabetically.
5.11 Finer control over housekeeping tasks
Previously the Zabbix housekeeper process could be completely disabled, using the DisableHousekeeping server configuration option. That was the recommended course of action if housekeeping encountered problems with, say, a large history table. That, however, also meant disabling all housekeeping tasks, while the real problem was only with one.
In Zabbix 2.2 a finer control over housekeeping tasks is introduced. The DisableHousekeeping parameter is not supported anymore. Instead, there is a fine-level control over housekeeping tasks in the frontend, in Administration → General → Housekeeper, where housekeeping tasks can be enabled/disabled on a per-task basis.
5.12 Permission improvements
Previously, if a user (through two different user groups) had both "Read" and "Read-write" permissions to a specific host, the host was only "Read" to them. That was very confusing.
In Zabbix 2.2 that has been fixed so that "Read-write" permissions have precedence over "Read". Now only “Deny” can restrict permissions to a host.
5.13 Linking templates with the same application name
Previously it was not possible to link templates having the same application name to the same host (or template). This is allowed in Zabbix 2.2.
5.14 Accessible history data for disabled hosts
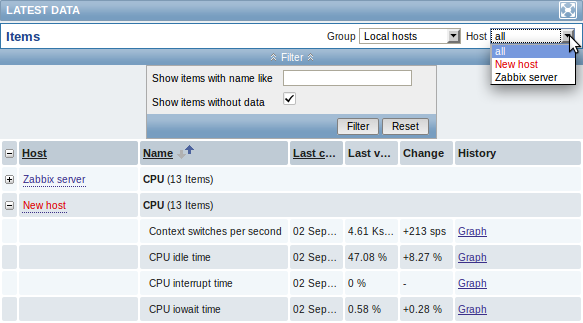
Disabled hosts are made available for host selection in Monitoring → Latest data as well as in Monitoring → Graphs and Monitoring → Web. Access to latest data includes access to graphs and item value lists for disabled hosts.
Where access to disabled host information is available, they are highlighted in red in host dropdowns and lists:
5.15 Changed maintenance period logic
Previously, a maintenance period for every second/third/etc day would first occur on the second/third/etc day after the Active since day. Now the first occurrence will take place on the Active since day and then every second/third/etc day.
5.16 SNMPv3 monitoring
5.16.1 Context name support
Optional setting of SNMPv3 context name is now supported in item, item prototype, low-level discovery rule or network discovery rule configuration. User macros are resolved in this field.
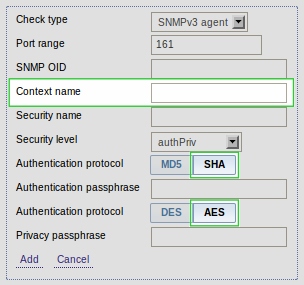
5.16.2 SHA/AES protocol support
Support for SHA authentication/AES privacy protocols has been added. Previously only MD5 authentication/DES privacy protocols were supported.
When configuring an SNMPv3 item, item prototype, low-level discovery rule or network discovery rule, the SHA option is additionally available for selection if authNoPriv is chosen as Security level or both SHA and AES options are available if authPriv is chosen as Security level:
5.17 Ability to extract matching part of a regular expression
The purpose of the improvement is to allow extracting only the interesting value from a target instead of returning the whole line when a regular expression match is found.
Zabbix already had the ability to search files, logs or web pages for a regular expression match. This ability was offered by such agent items as vfs.file.regexp[], log[], logrt[] and web.page.regexp[]. So far, however, if a regular expression match was found, the whole line containing the match was returned.
In Zabbix 2.2 these items have been extended to allow limiting the number of lines searched and to be able to extract desired values from these lines. This has been accomplished by adding to the items some additional parameters: <start line>, <end line>, <output>. For example, the vfs.file.regexp[] item now has gained all 3 additional parameters:
Whereas <start line> and <end line> are optional parameters allowing to specify the numbers of the beginning and ending lines in the search, output allows to indicate the subgroup of the match that we may be interested in.
So, for example
will allow to return the number of interest residing in the target file at the end of lines 3-5. The reason why Zabbix will return only the number is because output here is defined by \1 referring to the first and only subgroup of interest: ([0-9]+)
And, with the ability to extract and return a number, the value can be used to define triggers.
Similarly, the other extended items have gained the optional <output> parameter: log[], logrt[] and web.page.regexp[].
Related changes:
- if no match for the regular expression is found, an empty string is returned (instead of EOF)
vfs.file.regmatch[]has gained the <start line> and <end line> parameters
See also Zabbix agent item documentation.
5.18 Support of internal checks for proxies
Previously there was no easy way to monitor health of Zabbix proxies. Starting with Zabbix 2.2.0 the internal checks of hosts monitored by proxies are now processed by the proxies, allowing to monitor proxy performance metrics.
The following internal checks are supported by proxies:
- zabbix[proxy_history] (supported only by proxies - the number of values pending to be sent to the server)
- zabbix[boottime]
- zabbix[host,<type>,available]
- zabbix[hosts]
- zabbix[items]
- zabbix[items_unsupported]
- zabbix[java,,<param>]
- zabbix[process,<type>,<mode>,<state>] (alerter, db watchdog, escalator, node watcher, proxy poller, timer processes aren't supported, but two new processes are supported - data sender and heartbeat sender)
- zabbix[queue,<from>,<to>]
- zabbix[rcache,<cache>,<mode>]
- zabbix[requiredperformance]
- zabbix[uptime]
- zabbix[wcache,<cache>,<mode>] (trends cache is not supported by proxies)
See detailed specifications in internal checks documentation.
5.19 Templates
FreeBSD and OpenBSD templates now include network interface discovery rule.
Zabbix server template has been updated to include value cache related items and other entities.
Various services from the agentless template have been split out in individual templates.
All triggers in Template App Zabbix Server and Template App Zabbix Proxy have been updated to be less sensitive and use hysteresis.
All templates have been updated to use suffixes and aggregate functions.
All OS templates have been updated to include memory graph.
5.20 Network discovery changes
Starting with Zabbix 2.2.0 hosts discovered on different proxies will be always treated as different hosts. This allows to perform discovery on the same IP ranges used by different subnets.
5.21 Items
5.21.1 Database monitoring is now official
ODBC monitoring has been around in Zabbix for quite some time, but so far it has lacked proper documentation and has had the status of an unofficial feature. Now the item is finally documented and can boast the status of an official feature.
Also, item configuration for database monitoring in the frontend is improved. Previously, several parameters - DSN, username, password and SQL query were entered into a single field. Now the DSN is moved to the second parameter of the item key, while username and password get their own separate fields and only the SQL query is left in the original field, allowing to enter a multiline query with better readability.
5.21.2 Support of scientific notation in received values
Items with "Numeric (float)" type of information now support receiving values and specifying a multiplier in scientific notation. E.g. 1.234e+5.
5.21.3 Improved items
logrt on Windows now supports multibyte path names. E. g. logrt[c:\логи\app1.*].
system.swap.size on Windows and Tru64 now supports the "used" parameter. E.g. system.swap.size[all,used].
eventlog now supports Windows eventlog messages from the new eventing system log ("Windows Eventing 6.0") introduced with Windows Vista.
eventlog now supports regular expressions in source filter.
5.21.4 Changed items
zabbix[items] internal check now returns the number of monitored items, instead of the total number of items in database.
5.21.5 New items
system.swap.size is now supported on AIX.
net.if.discovery is now supported on FreeBSD, OpenBSD and NetBSD.
system.sw.arch is now supported on NetBSD, OpenBSD, Mac OS X, AIX, HP-UX, Solaris, Tru64, FreeBSD and Windows.
proc.num, net.if.in, net.if.out and net.if.total are now supported on HP-UX. Note: net.if.in, net.if.out and net.if.total items do not provide statistics of loopback interfaces (e.g. lo0).
sensor is now supported on Linux 2.6+.
zabbix[hosts] internal check returns the number of monitored hosts.
wmi.get is added to Windows agent to provide WMI query support.
5.21.6 Trend calculation
The trend average value calculation for items of unsigned numeric data types was improved. Previously average value was kept as an integer, thus precision would be lost if change between two values was small. For example, for values going from 1 to 5 average result would be 1. This has been changed to keep the sum of the values and only compute the average when storing it in the database. Note that the result is still stored as an integer in the database. For example, if item has values 0 and 1, the average value will be 0, not 0.5.
There is no change for decimal items, average is still computed as a number with decimal part.
5.21.7 Validation changes
A more strict parameter validation by Zabbix agent has been introduced. Whereas previously parameters for items that do not support parameters would be ignored, now the items will return ZBX_NOTSUPPORTED and become unsupported.
5.22 Trigger functions
5.22.1 Logical functions for testing bits
A new function band() (bitwise AND) is now supported. For example, to test that the most and the least significant bits in byte are set to 1, a trigger expression could be like
Function count() has been enhanced by adding "band" to supported operators. For example, to count the number of values for last 10 minutes having '110' (in binary) in the 3 least significant bits, an expression could be
where '6' is a number to compare with (i.e. '110') and '7' is a bitmask (i.e. '111' in binary).
5.22.2 Time suffix support for testing
Support for standard Zabbix time suffixes ("s", "m", "h", "d" and "w") has been added to trigger expression condition test page and can be used to test values.
5.22.3 Improved nodata() function calculation
Previously, when a new item was added (for example, by creating item, adding a host or linking a host to a template) and there was a trigger with nodata() function, it would likely fire before the item would get a chance to send in any values. Since Zabbix 2.2.0, the nodata() function will fire only after the time period, specified in the function parameters, has passed.
5.23 Macros
5.23.1 New notification macros
To make notifications more informative and to support the new functionality in Zabbix for receiving notifications based on internal events, a much expanded set of macros is supported in notifications:
- {ACTION.ID}, {ACTION.NAME} - return the ID or name of the action that delivered the notification. Supported in actions of all event sources.
- {EVENT.STATUS}, {EVENT.VALUE} - return the verbal state and numeric state of the event that caused a notification. Supported in trigger and internal event-based actions. In addition, all previously existing EVENT.* macros are limited to returning information of the original problem event only - as recovery event information is returned by the new EVENT.RECOVERY.* macros.
- {EVENT.RECOVERY.ID}, {EVENT.RECOVERY.DATE}, {EVENT.RECOVERY.TIME}, {EVENT.RECOVERY.STATUS}, {EVENT.RECOVERY.VALUE} - return the ID/date/time/verbal state or numeric state of a recovery event. These macros are designed specifically for recovery messages. Supported in trigger and internal event-based actions.
- {ITEM.STATE}, {TRIGGER.STATE} - return the verbal state of the item/trigger that caused a notification.
- {LLDRULE.NAME.ORIG}, {LLDRULE.KEY.ORIG} - return the original name or key (with macros not expanded) of an LLD rule.
- {LLDRULE.ID}, {LLDRULE.NAME}, {LLDRULE.KEY}, {LLDRULE.DESCRIPTION}, {LLDRULE.STATE} - return the ID/name/key/description or verbal state of the low-level discovery rule that caused a notification.
For more details, see macros supported by location.
5.23.2 Support of LLD macros in trigger expressions
Low-level discovery macros can now be used in trigger expression standalone constants. For example, {#MY_CUSTOM_MACRO} from:
can be used in the following trigger prototype:
To be expanded correctly, the macro must return a numeric value. If the macro value is not numeric or no value is found, a real trigger will not be created.
5.23.3 Support of LLD macros in item and trigger descriptions
Low-level discovery macros can now be used in trigger and item descriptions.
5.23.4 Macros in trigger descriptions
The set of macros previously supported in trigger names is now also supported in trigger descriptions: {HOST.HOST}, {HOST.NAME}, {HOST.CONN}, {HOST.DNS}, {HOST.IP}, {ITEM.VALUE}, {ITEM.LASTVALUE} and {$MACRO}.
These macros will be expanded when viewing the trigger comment in Monitoring → Triggers and also inside the {TRIGGER.DESCRIPTION} macro when used in notifications.
5.23.5 Macros in global scripts
User macros are now supported in global script commands and confirmation texts.
The confirmation text for global scripts will now also expand host name macros - {HOST.HOST}, {HOST.NAME} and host connection macros - {HOST.IP}, {HOST.DNS}, {HOST.CONN}.
5.23.6 User macros in allowed hosts
User macros are now supported in the Allowed hosts field of trapper items.
5.24 Frontend improvements
5.24.1 Improved layout
With the redesign of Zabbix 2.0, some frontend pages did not look very satisfactory at a more narrow browser window size (or on small form factor devices). Significant improvements have been made for Zabbix 2.2, and now most of the pages should scale down much better. For example, the general frontend setting page at the same width before and after the redesign looks quite differently:
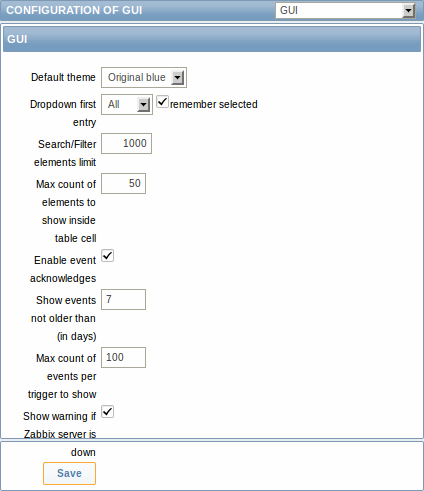 |
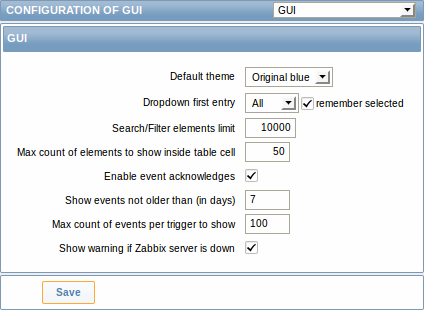 |
| Before the redesign. | After the redesign. |
5.24.2 Latest data section
Expand/collapse without page reload
Latest data page was improved to expand/collapse individual entries (per application or host) without page reload. While increasing the page size, it results in a much smaller amount of requests and smoother user experience.
Show details option
The filter has a new Show details option. If used, it allows to extend displayable information on the items by such details as refresh interval, history and trends settings, item type and item errors (fine/unsupported).
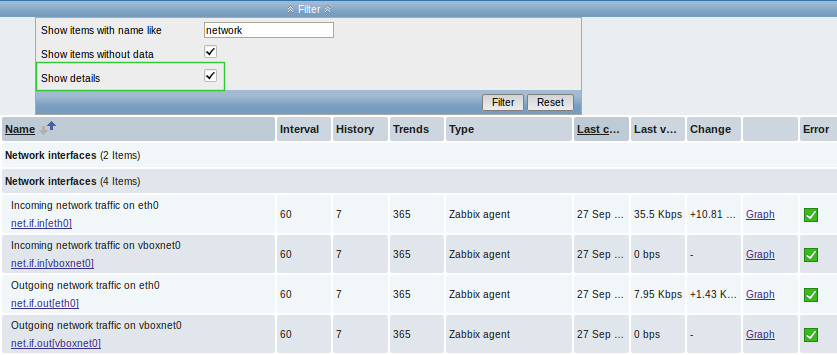
A direct link to item configuration is also available allowing to quickly tweak an item from the monitoring section.
5.24.3 Configuration options and monitoring data accessible from host inventory
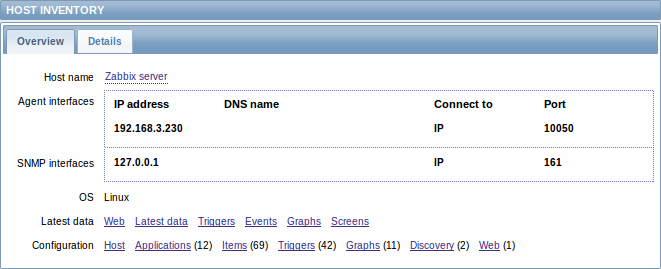
In host inventory details (accessible through Inventory → Hosts) there are two tabs now - Overview and Details. While Details, as before, present all inventory data maintained with the host, Overview presents some useful general information about the host along with links to predefined scripts and various aspects of host configuration and monitoring data.
5.24.4 More flexible dashboard filter
The dashboard filter has gained the ability to not only show selected groups, but to hide selected groups as well. This offers more flexibility for displaying hosts.
For example, we may have hosts 001, 002, 003 in Group A and hosts 002, 003 in Group B as well. If we select to show Group A and hide Group B at the same time, only data from host 001 will be displayed in the Dashboard.
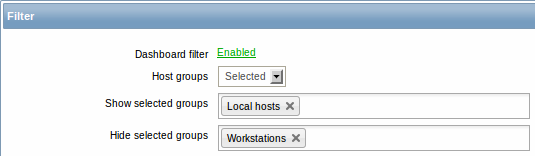
To enable the show/hide functionality, two new fields are introduced in the dashboard filter form for when Selected is chosen in Host groups field. Show selected groups and Hide selected groups both are auto-complete so starting to type the name of a group will offer a dropdown of the matching groups.
If nothing is selected in Show selected groups, then all groups will be displayed, except the ones chosen to hide in the Hide selected groups field.
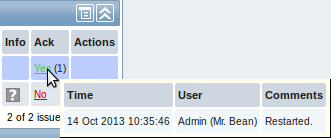
5.24.5 Displaying name and surname with acknowledgements
Previously, only user alias was displayed with acknowledged events - that sometimes did not provide sufficient information, especially in systems with many system users.
To make acknowledgement information more informative, now a name and surname is also displayed, in the 'alias (name surname)' format. The name and surname are taken from the respective (now optional) user configuration fields.
Name and surname now appears in:
- acknowledgement and action details popup of the Dashboard Last 20 issues widget
- acknowledgement and action details popup of the Host/host group issues widget in screens
- acknowlegdement details (accessible from Monitoring → Triggers)
- event details
- user group member list
- user selection in user group configuration
- action operation list
- action operation configuration tab
5.24.6 Ability to view acknowledgements in trigger status page
Previously, when viewing triggers without events in Monitoring → Triggers page, it was possible to see that a trigger has been acknowledged, but there was no way to see the acknowledgement. The acknowledged status can now be clicked to view the details.
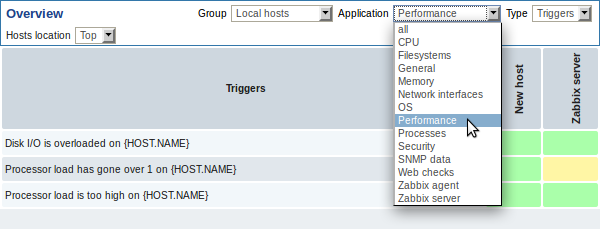
5.24.7 Overview filtered by application
The Monitoring → Overview section has gained an additional filtering-by-application option.
Previously, all items or all triggers would be displayed in the overview of hosts, which did not allow to focus on the information one was mostly interested in. Now the overview can be narrowed down by selecting a specific application and only displaying those items or triggers that are under the selected application.
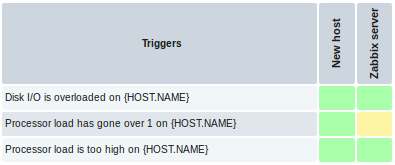
The overview filtering option is also made available in Configuration → Screens. When configuring Data overview and Trigger overview screen elements, a new Application field is available for entering the required application name:
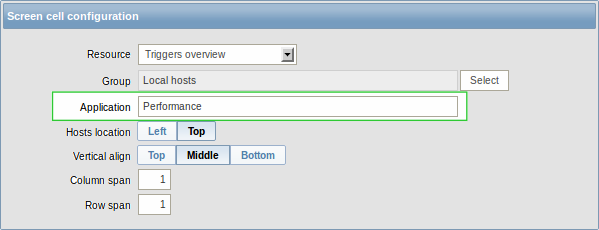
The result can be a very neat and concise screen element for viewing in Monitoring → Screens:
5.24.8 Ability to append host groups, item applications on mass update
Previously, when using mass update for hosts or items, it was possible to replace host groups and replace item applications. The previous host groups/applications were unlinked and replaced with the specified ones.
Now, while the replace function is still available, the mass update forms have gained an additional field for adding host groups or item applications. Using this field, both existing host groups/applications as well as completely new ones can be added.
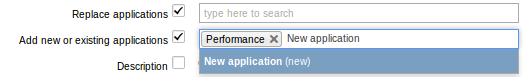
This additional field is auto-complete and starting to type in it offers a dropdown of the matching host groups/applications. If the host group/application is new, it also appears in the dropdown and is indicated by (new) after the string. Just scroll down to select.
5.24.9 Screen element changes
Status of host triggers and Status of host group triggers screen elements have been renamed to Host issues and Host group issues respectively.
Previously, triggers without events would not be displayed in these two widgets, nor in the Last 20 issues widget. As a result, sometimes problem triggers would disappear from the widgets when their events got deleted by the housekeeper. To fix this, now triggers without events are displayed as well.
5.24.10 Hierarchy in global scripts
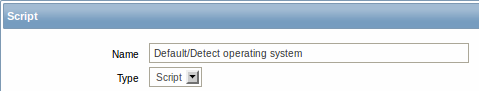
Global scripts can be put into categories now. To put a script into a category, prefix it with a desired path, for example, Default/, when configuring the script name.
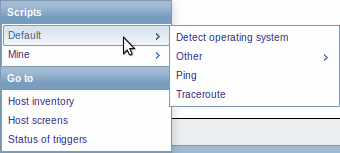
When accessing scripts through the menu in monitoring sections, they will be organized according to the given categories:
5.24.11 Editable discovery checks
Previously discovery checks within a discovery rule could only be created and deleted. To edit an existing check it had to be deleted first and a new one created, which could be quite cumbersome with a check having several parameters. In Zabbix 2.2, discovery checks can be edited directly.
|<| |<| |-| |<|
5.24.12 Improved host, template, host group selection
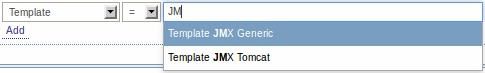
Host, template and host group selection fields have been improved in several locations in the frontend. Where previously a popup was displayed for selection, now an auto-complete field is available.

Starting to type in it offers a dropdown of the matching entities.
The new selection fields are implemented in:
- template linkage (in both host and template configuration)
- action conditions
- host/item mass update options
- map element editing
- screen element editing for several resources
- discovery action operations (for selecting template, host group)
- remote commands
- custom script configuration
- item filter
5.24.13 Multi-selection of values in action conditions
Previously, when selecting an action condition of the same type, it was impossible to select more than one value at a time. Selecting ten hosts would mean that all ten hosts would have to be added one at a time.
Now, for host/template/trigger/host group conditions in trigger based actions, a multi-select field is available, where several values can be selected and then added in one go. The same improvement is available for host/template/host group conditions in internal event based actions.
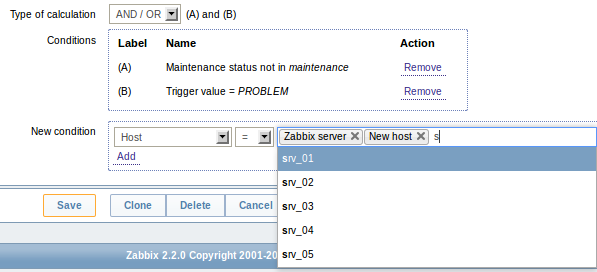
The selection field is auto-complete, so starting to type in it offers a dropdown of all the matching values. Just scroll down to select.
In a related improvement, selected action condition values are now displayed in italics, rather than in quotes, resulting in better readability.
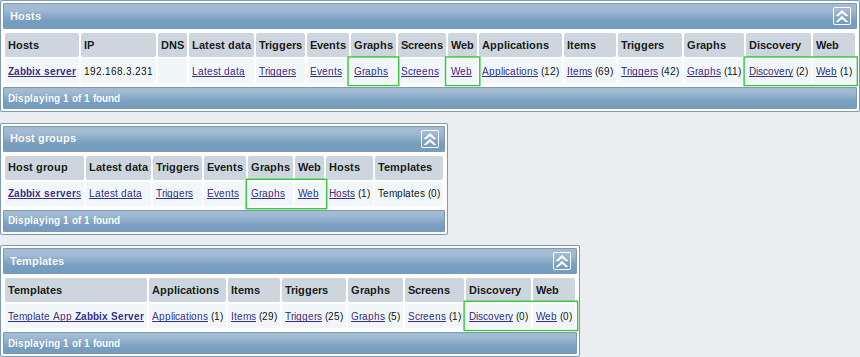
5.24.14 Improved global search page
Global search results, compared to the previous version, have gained links to:
- graph monitoring (for hosts and host groups)
- web monitoring (for hosts and host groups)
- low-level discovery rule configuration (for hosts and templates)
- web scenario configuration (for hosts and templates)
5.24.15 Miscellaneous improvements
Host mass update form has been improved by making it more similar to host properties. Introduction of tabs allows to easier find the desired controls, and options like inventory fields now are much easier to distinguish from other fields.
Regular expression editing form has been redesigned.
- Testing has its own tab now
- The logic of displaying testing results has been improved. Results are shown after applying the condition, not before:
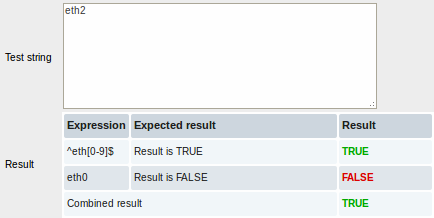 |
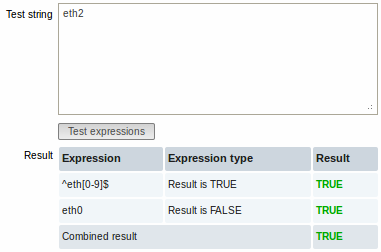 |
| Previously, the result of comparison would be displayed immediately, disregarding a possibly negative condition, such as Result is FALSE. | Now the result is displayed after taking into account both comparison and the condition and the result is displayed correctly. |
- Instead of checkboxes and Delete button, Remove links for each entry are used
Maintenance period configuration form has been redesigned, including a more compact layout and Remove links instead of checkboxes and a Delete selected link.
Most forms will now auto-focus on the first field.
The list of actions will now display what media type is used when sending notifications.
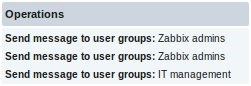 |
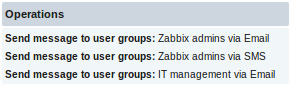 |
| Previously two operations with the same recipient looked the same even if they were using different media. | Now the difference is clear by seeing the media type used. |
Also, when displaying a system user that the message is sent to, the name and surname of the user (as configured in user configuration) is displayed in parentheses after the alias.
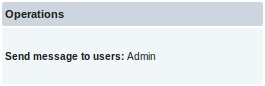 |
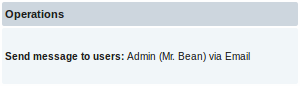 |
| Before Zabbix 2.2. | In Zabbix 2.2. |
Previously, if time selection fields were used, for instance, to set a maintenance period, the current time was always displayed by default. Now, 0 hours and 0 minutes are displayed instead.
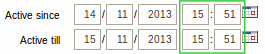 |
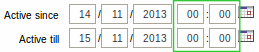 |
| Before Zabbix 2.2. | In Zabbix 2.2. |
There are multiple places in the Zabbix frontend where colours can be specified, including graph and network map properties. Previously, colour code validation was implemented separately for each location, and error messages varied in quality. Now all locations use single validation process, and error messages have been improved and unified.
"Access denied" pages have been unified and an option to log in will now always be provided.
Previously, when the flexible interval limit for an item was reached, Zabbix did not allow to add more intervals, but did not indicate the reason to the user. Since Zabbix 2.2.0, after adding 7 flexible intervals to an item, the message "Maximum number of flexible intervals added" is shown:

Send to field length in user media properties was increased to allow easier entering of long e-mail addresses.
Overall frontend and API memory usage was decreased by optimising database access function and reducing its memory usage by 22-95%.
Previously, enabling debug mode for guest user did not allow it to view debug information anyway. Debug information is available for guest user in Zabbix 2.2.
Previously, new map elements were added with label set to Bottom, instead of the map default. Now new elements will have the label set to map default, and it will be possible to change that later. Additionally, instead of - (a single dash), text Default will be used to identify the default location.
The frontend now uses relative links only. Previously, absolute links were used in a few locations, which caused problems with certain web server setups, such as reverse proxies.
In bulk actions the dropdown below the list and the Go button are now disabled if no items are selected or all items on that page are LLD-created items. "Select all" is also disabled if all items on that page are LLD-created items.
Previously, Print functionality did a full page reload. This was changed to a pure JavaScript solution, which works faster and in a more robust way.
Slightly obscure "No <entity> defined" messages have been changed to explain what type of entity exactly has not been found - for example, "No maintenance defined" has been changed to "No maintenance periods found".
Previously, the frontend configuration wizard during a pre-requisites check used yes/no to denote PHP configuration parameter status. It has been changed to display on/off to match settings in php.ini.
"All" has been removed as a choice from the trigger severity filter in the frontend, being a redundant duplicate of the "Not classified" option. The show_severity=-1 GET parameter, previously returning "All", now defaults to the "Not classified" selection.
5.24.16 Antialiasing in generated graphics
From now on generated graphs are easier to comprehend due to antialiasing. The change includes support of normal and bold anti-aliased lines lines for graphs, map connectors as well as graph X/Y axis triangles.
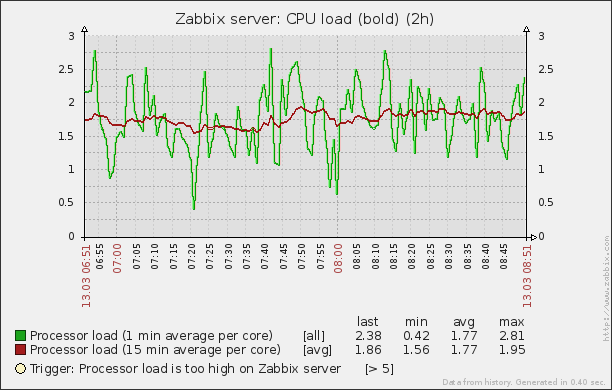 |
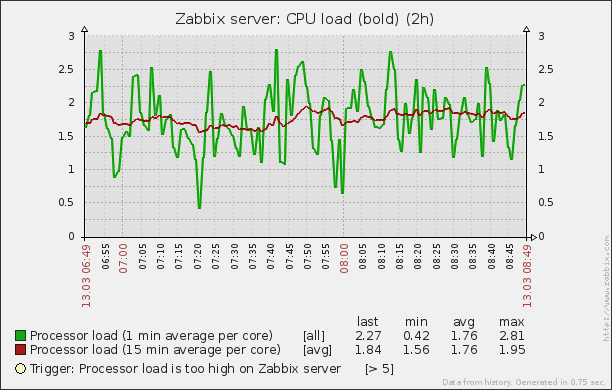 |
| Before the redesign. | After the redesign. |
5.25 Daemon improvements
5.25.1 Automatic database upgrade
Starting with 2.2.0, Zabbix server and proxy will automatically upgrade the database - manual SQL patch execution is not required anymore.
Automatic database upgrade for SQLite is not supported.
5.25.2 Zabbix proxy improvements
Zabbix proxies will now be able to work uninterrupted for much longer when used with PostgreSQL because of increased history value ID range.
Zabbix proxies send values together with item configuration (like host name and item key). Previously, this data was retrieved from the local database, but starting with Zabbix 2.2.0 it will be retrieved from the configuration cache - but only for historical data (excluding network discovery and active agent auto-registration events).
5.25.3 Support for long and string SNMP indexes
Previously, SNMP low level discovery only used the last value from the OID. This caused problems when the index was longer. For example, in the following OIDs the last two numbers together represent the index:
CISCO-POP-MGMT-MIB::cpmDS1ActiveDS0s.6.0
       CISCO-POP-MGMT-MIB::cpmDS1ActiveDS0s.6.1
       CISCO-POP-MGMT-MIB::cpmDS1ActiveDS0s.7.0
Without long index support Zabbix would create items for the first two OIDs as 0 and 1, then fail to create item for the third OID. Now the full OID part will be used.
Additionally, strings as indexes are supported since Zabbix 2.2.0.
5.25.4 Value cache for faster access to history data
To make the calculation of trigger expressions, calculated/aggregate items and some macros much faster, a new value cache option is supported by the Zabbix server.
This in-memory cache can be used for accessing historical data, instead of making direct SQL calls to the database. If historical values are not present in the cache, the missing values are requested from the database and the cache updated accordingly.
To enable the new functionality, a new optional ValueCacheSize parameter is supported by the Zabbix server configuration file.
Two new internal items are supported for monitoring the value cache: zabbix[vcache,buffer,<mode>] and zabbix[vcache,cache,<parameter>]. See more details with internal items.
5.25.5 Reducing update operations in item table
Previously Zabbix would update several fields in the 'items' table for each new value, resulting in a large number of SQL update operations and an obvious performance bottleneck. To reduce the number of update operations, shared memory is now used to store fields related to the last and previous value of items, bringing great benefit to server performance.
Additionally, queue-related internal checks use information from shared memory instead of accessing the database.
5.25.6 Improved work with configuration and history caches
Zabbix server and proxy daemons will support bulk access to configuration and history caches. It will reduce the quantity of system calls of operation with semaphores and will positively affect system performance.
More specifically, Zabbix trapper processes, when receiving collected values from active agents or proxies, previously obtained item configuration from the cache one by one, locking the cache each time. Since Zabbix 2.2 they will obtain all required information in one operation.
Similarly Zabbix Java gateway pollers will retrieve information about all items they should be collecting data for in one operation.
When sending configuration data to active agents the same principle applies - item configuration from the cache is retrieved in one operation.
5.25.7 Multiple timer processes
Zabbix server daemon will support parallel processing of time-based functions. A user can specify the number of timer processes in the new StartTimers configuration parameter.
5.25.8 Logging the used configuration file name
Zabbix daemons will now include the used configuration file name in the startup log messages. For example, agent daemon startup messages would have an additional line like this:
10159:20130404:184230.963 Starting Zabbix Agent [A Test Host]. Zabbix 2.1.0 (revision 34816).
       10159:20130404:184230.963 using configuration file: /usr/local/etc/zabbix_agentd.conf
5.25.9 JSON validation on server
Previously, a slightly incorrect JSON could silently get accepted by the Zabbix server. Starting with Zabbix 2.2, syntax validation is performed, before parsing JSON data. Opening invalid JSON data will immediately return failure and the parsing error will be logged as warning.
5.25.10 Host metadata for host auto-registration
Previously it was only possible to use a hostname to differentiate hosts when using active agent auto-registration. In some cases (for example, Amazon cloud nodes) it would be great to keep the original hostname while also use other information sent by the agent for auto-registration purposes.
To make such extra information available, support for 2 new agent configuration parameters was added:
- HostMetadata. An optional parameter that defines host metadata. If not defined, the value will be acquired from HostMetadataItem.
- HostMetadataItem. An optional parameter that defines an item used for getting host metadata. This option is only used when HostMetadata is not defined.
Host metadata is used only at a host auto-registration process.
5.25.11 Dynamic display of current process activity and statistics
Zabbix processes now show a process type, instance number (if there can be more than one process of this type), current activity and some statistics from previous activity by changing their commandlines:
zabbix22  4584     1  0 14:55 ?    00:00:00 zabbix_server -c /home/zabbix22/zabbix_server.conf
       zabbix22  4587  4584  0 14:55 ?    00:00:00 zabbix_server: configuration syncer [synced configuration in 0.041169 sec, idle 60 sec]
       zabbix22  4588  4584  0 14:55 ?    00:00:00 zabbix_server: db watchdog [synced alerts config in 0.018748 sec, idle 60 sec]
       zabbix22  4608  4584  0 14:55 ?    00:00:00 zabbix_server: timer #1 [processed 3 triggers, 0 events in 0.007867 sec, 0 maint.periods in 0.005677 sec, idle 30 sec]
       zabbix22  4637  4584  0 14:55 ?    00:00:01 zabbix_server: history syncer #4 [synced 35 items in 0.166198 sec, idle 5 sec]
       zabbix22  4673  4670  0 14:55 ?    00:00:00 zabbix_proxy: configuration syncer [synced config 15251 bytes in 0.111861 sec, idle 60 sec]
       zabbix22  4674  4670  0 14:55 ?    00:00:00 zabbix_proxy: heartbeat sender [sending heartbeat message success in 0.013643 sec, idle 30 sec]
       zabbix22  4688  4670  0 14:55 ?    00:00:00 zabbix_proxy: icmp pinger #1 [got 1 values in 1.811128 sec, idle 5 sec]
       zabbix22  4690  4670  0 14:55 ?    00:00:00 zabbix_proxy: housekeeper [deleted 9870 records in 0.233491 sec, idle 3599 sec]
       zabbix22  4701  4670  0 14:55 ?    00:00:08 zabbix_proxy: http poller #2 [got 1 values in 0.024105 sec, idle 1 sec]
       zabbix22  4740  4738  0 14:55 ?    00:00:00 zabbix_agentd: listener #1 [waiting for connection]
       zabbix22  4741  4738  0 14:55 ?    00:00:00 zabbix_agentd: listener #2 [processing request]
The commandline of the main process is shown unchanged (in previous versions it was displaying "main process" on BSD platforms)
See also Viewing Zabbix process performance with "ps" and "top".
5.25.12 Miscellaneous daemon improvements
- Zabbix pinger processes do not use a connection to database anymore.
- Zabbix agent daemon already supported the AllowRoot parameter. Since Zabbix 2.2.0, server and proxy daemons also support it.
- Accepted data limit when using Zabbix protocol is changed from 128MB to 64MB (in versions 2.2.0-2.2.2; reverted to 128MB starting from 2.2.3). Any other data (including older Zabbix protocols) stays limited at 16MB.
- Zabbix server and proxy daemons now correctly use the Timeout configuration parameter when performing SNMP checks. Additionally now the daemons do not perform retries after a single unsuccessful (the timeout/wrong credentials) SNMP request. Previously the SNMP library default timeout and retry values (1 second and 5 retries respectively) were actually used.
- Spaces are now allowed in the Server parameter in the agent daemon configuration file.
- Spaces are now allowed in the Allowed hosts field for Zabbix trapper items.
- IP address comparison (for example, for checking incoming connections in Zabbix agent or for Zabbix trapper items) was more efficient if the daemon has been built without IPv6 support. Now it should be on the same performance level as with IPv6 support enabled.
- Zabbix proxies previously sent availability data for templates when they first started up. While harmless, this was not required. Since 2.2.0, availability data is sent for monitored hosts only, reducing network traffic slightly.
- Zabbix server previously did not respond to proxy configuration and heartbeat requests that had incorrect proxy name. Starting with 2.2, failure response is returned.
- Zabbix server now logs response to global script request at DebugLevel 4.
- Zabbix server previously discarded non-numeric characters in global script request values, and silently closed the connection if any of the required parameters were missing. Since 2.2, non-numeric characters and missing required values result in an error message being returned.
- Setting display name for From and To addresses for outgoing e-mails is now supported. For example, entering "Zabbix Riga <[email protected]>" is supported.
- Zabbix agent now also prints the Aliases and PerfCounters specified in the agent configuration file when run with a -p parameter .
- Zabbix agent now returns ZBX_NOTSUPPORTED in case of invalid timeout or count values of a net.dns check.
- Zabbix agent previously returned 0 in case of successful exit and 255 in case of failure. Starting from version 2.2.0 Zabbix agent returns 0 in case of successful exit and 1 in case of failure.
- Starting from version 2.2 a check for non-UTF-8 characters in the configuration files of server, proxy or agent was added. In case of a non-UTF-8 character specified in a parameter value the program will exit immediately, reporting an error.
- Zabbix agent has an improved system.hostname and system.uname querying mechanism. The data is retrieved using a uname() system call instead of forking a shell and running uname or hostname commands.
- Reduced database load when evaluating trigger expressions containing user macros.
- Zabbix server now caches global regular expressions in configuration cache.
- Extra whitespace in comma-delimited lists is more widely supported in the configuration files now - it's now also supported in ListenIP parameter for Zabbix proxy, server and agent and ServerActive parameter for Zabbix sender.
- Improved formatting of a trapper response to values sent by Zabbix sender. The new info field format is "processed: <N>; failed: <N>; total: <N>; seconds spent: <N>".
- Maximum length of an alert message has been increased for Oracle database.
5.26 API improvements
** New host prototype API **
A host prototype API has been implemented with the development of VM support for low-level discovery rules and can be used to manage host prototypes. It comes with the standard get, create, update, delete, isreadable and iswritable methods.
** Changes to the get method "output" parameter **
The "output" parameter will now also accept arrays of property names to return only the requested data in all "get" methods. It will no longer support the "shorten" value. The "refer" value has been deprecated and will be removed in Zabbix 2.4.
** Improved get method subselects **
All get method subselects will now also accept arrays of property names to return only the requested data. To standardise the returned results, they will always return arrays of objects.
** "Webcheck" API renamed to "httptest" **
To be consistent with the naming conventions of other web-related objects, the "webcheck" API has been renamed to "httptest". The name "webcheck" has been deprecated.
** New "text" data type **
A new "text" data type has been introduced for storing long text strings. It's now used for storing alert messages, and text and log history values. Note that fields of this type are not supported by the get method "filter" parameter.
** Improved validation **
API input has been improved and made stricter for most of the methods.
** Even more changes and bug fixes **
For a fully detailed list of changes and bug fixes see the API changelog.
5.27 Miscellaneous
** Full 64-bit range for object IDs **
Zabbix now supports a signed 64-bit range for internal object IDs in a standalone, non-distributed setup. Thus the highest available number of one-type objects is 263-1 now.
** Additional service types in network discovery action condition **
HTTPS and telnet service type conditions now are available in network discovery action configuration.
** Removed duplicated indexes in Zabbix MySQL database schema **
Redundant indexes were removed in several Zabbix MySQL database tables. This should improve performance and slightly reduce the database size for MySQL users in these cases:
- child nodes in distributed mode
- Zabbix proxy value collection, network discovery and active agent autoregistration data processing
Added indexes on child-table columns having foreign key constraints
Such indexes were created automatically on MySQL, now they are created also on PostgreSQL, Oracle, DB2 to improve performance of Zabbix server and frontend operations with these databases.
Dynamic link library with Zabbix sender functionality on Windows
A dynamic link library with basic Zabbix sender functionality is available on the Windows platform. It allows sending data to server/proxy without having to launch the Zabbix sender process. See the documentation for detailed information.
Zabbix sender exit status changes
Zabbix sender will now finish with the exit status 0 only if all of the values are sent and processed successfully. If the processing of at least one of the values fails, the exit status will be 2. If data sending fails, the exit status will be 1. Additionally if no arguments or server are specified the exit status will be 1 and for -h and -V options the exit status will be 0 (before Zabbix 2.2.0 exit status in the listed situations was 255).
Improved error reporting in the frontend
Previously, when an SNMP, JMX and IPMI host became unavailable, trigger error messages could include a reference to Zabbix agent. As Zabbix agent is not involved in those cases, in Zabbix 2.2 these messages will explicitly refer to SNMP, JMX and IPMI agent instead.
More up to date built-in item key help
Help data on built-in item keys should be more up to date now - previously it was stored in the database and only updated in major versions. Since 2.2 it is stored in the frontend and any frontend update will provide information on new or improved items.