

Table of Contents
4 Latest data
Overview
The Monitoring → Latest data section displays the latest values gathered by items.
Just click on '+' before a host and the relevant application, and the items of that host and application will be displayed with their latest values.
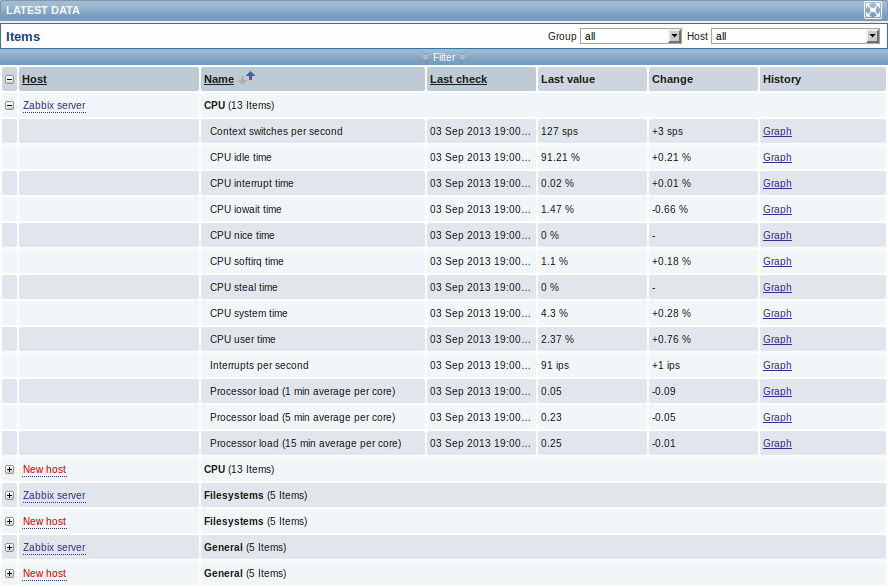
You can expand all hosts and all applications, thus revealing all items by clicking on '+' in the header row.
Note: The name of a disabled host is displayed in red (in both the host dropdown and the list). Data of disabled hosts, including graphs and item value lists, is accessible in Latest data starting with Zabbix 2.2.0.
Items are displayed with their name, last check time, last value, change amount and a link to a simple graph/history of item values.
Starting with Zabbix 2.2.4, only values that fall within the last 24 hours are displayed by default. This limit has been introduced with the aim of improving initial loading times for large pages of latest data. It is also possible to change this limitation by changing the value of ZBX_HISTORY_PERIOD constant in include/defines.inc.php.
Starting with Zabbix 2.2.4, for items with update frequency of 1 day or more the change amount will never be displayed (with the default setting). Also in this case the last value will not be displayed at all if it was received more than 24 hours ago.
Using filter
You can use the filter to display only the items you are interested in. The filter link is located above the table in the middle. You can use it to filter items by a string in the name; you can also select to display items that have no data gathered.
Moreover, Show details allows to extend displayable information on the items. Such details as refresh interval, history and trends settings, item type and item errors (fine/unsupported) are displayed. A link to item configuration is also available.
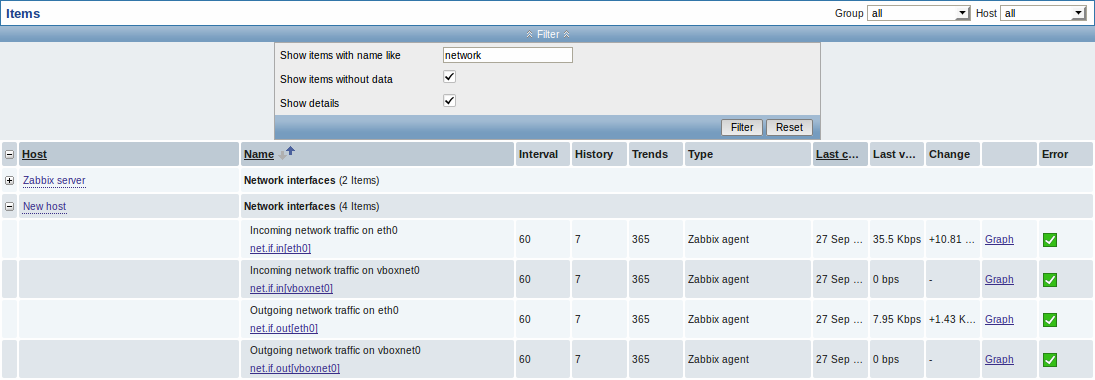
By default, items without data are not shown and details are not displayed either.
Links to value history/simple graph
The last column in the latest value list offers:
- a History link (for all textual items) - leading to listings (Values/500 latest values) displaying the history of previous item values.
- a Graph link (for all numeric items) - leading to a simple graph. However, once the graph is displayed, a dropdown on the upper right offers a possibility to switch to Values/500 latest values as well.
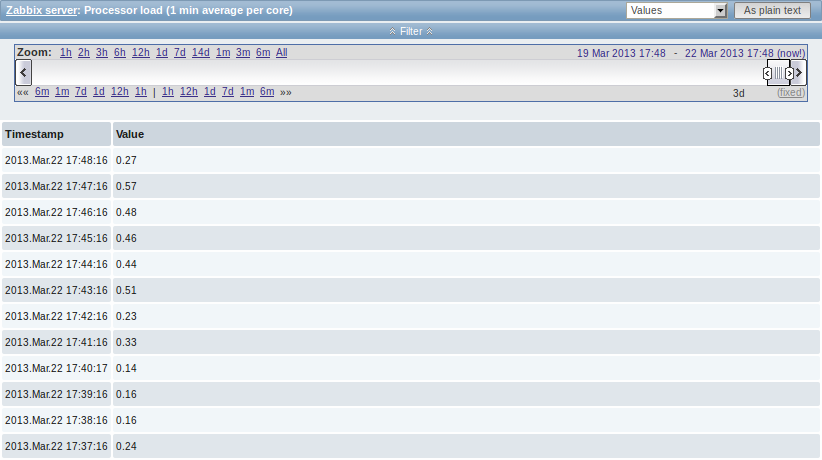
The values displayed in this list are "raw", that is, no postprocessing is applied.
The total amount of values displayed is defined by the value of Search/Filter elements limit parameter, set in Administration → General.