

Table of Contents
5 Triggers
Overview
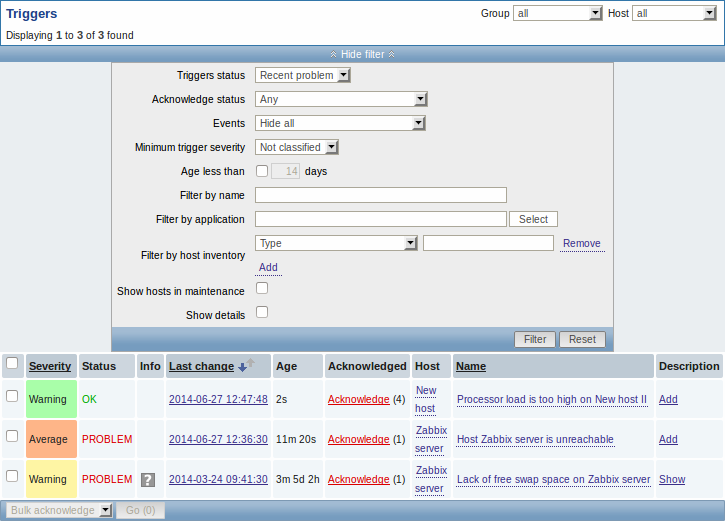
The Monitoring → Triggers section displays the status of triggers.
| Column | Description |
|---|---|
| Severity | The trigger severity is displayed. The color of the severity is used as cell background for problem triggers. For OK triggers, green background is used. |
| Status | The trigger status is displayed - OK or PROBLEM. By default, it will be blinking for 30 minutes for triggers that have recently changed their state. Additionally, triggers that have recently changed their state to OK, will be displayed for 30 minutes even if the filter is set to show only problems. Text color and blinking options can be configured in Administration → General → Trigger displaying options. |
| Info | A grey icon with a question mark indicates that there is some relevant information to be displayed. If you move your mouse pointer over it, the message will be displayed. |
| Last change | The date and time of last trigger status change is displayed. |
| Age | The age of last trigger status change is displayed. |
| Acknowledged | The acknowledgment status of the trigger is displayed: Acknowledged - green text indicating that the trigger is acknowledged. A trigger is considered to be acknowledged if all problem events for it are acknowledged (or if there have been only OK events). Acknowledge - a red link indicating unacknowledged problem events (and their number in parenthesis). If you click on the link you will be taken to a bulk acknowledgement screen where all events for this trigger can be acknowledged at once. Note: If you wish to acknowledge a single event only, go to Monitoring → Events. No events - if there have been no problem events for the trigger. Displaying this string is supported since Zabbix 2.0.4; prior to that these triggers were displayed as Acknowledged. |
| Host | The host of the trigger is displayed. It is also a link to the defined custom scripts, latest host data, host inventory overview and host screens. |
| Name | The name of the trigger is displayed. It is also a link to the trigger event list and the trigger configuration page, as well as to a simple graph of item data. The link list may also contain a custom trigger URL, if one is defined in trigger configuration. |
| Description | A link to trigger description. |
Using filter
You can use the filter to display only the triggers you are interested in. The filter link is the blue bar located above the table.
By default only triggers in a 'Recent problem' status are displayed - including both problem triggers and triggers that only very recently changed to OK. You may also select to display triggers in 'Problem' status (only problem triggers) or 'Any'.
Note that if you select 'Any' the next time you return to the page 'Recent problem' will be selected by default, whereas if you select 'Problem' the next time you return 'Problem' will remain selected.