
Table of Contents
3 New item
Overview
In this section you will learn how to set up an item.
Items are the basis of gathering data in Zabbix. Without items, there is no data - because only an item defines a single metric or what data to get off of a host.
Adding item
All items are grouped around hosts. That is why to configure a sample item we go to Configuration → Hosts and find the 'New host' we have created.
The Items link in the row of 'New host' should display a count of '0'. Click on the link, and then click on Create item. This will present us with an item definition form.
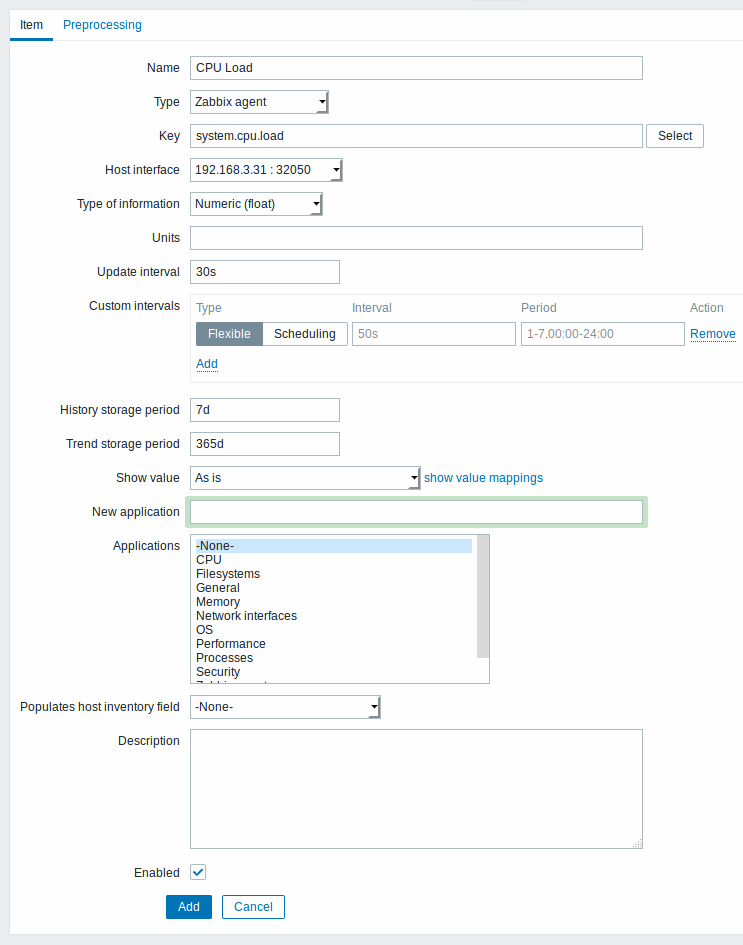
For our sample item, the essential information to enter is:
Name
- Enter CPU Load as the value. This will be the item name displayed in lists and elsewhere.
Key
- Manually enter system.cpu.load as the value. This is a technical name of an item that identifies the type of information that will be gathered. The particular key is just one of pre-defined keys that come with Zabbix agent.
Type of information
- Select Numeric (float) here. This attribute defines the format of expected data.
You may also want to reduce the amount of days item history will be kept, to 7 or 14. This is good practice to relieve the database from keeping lots of historical values.
Other options will suit us with their defaults for now.
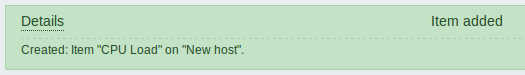
When done, click Add. The new item should appear in the itemlist. Click on Details above the list to view what exactly was done.
Seeing data
With an item defined, you might be curious if it is actually gathering data. For that, go to Monitoring → Latest data, select 'New host' in the filter and click on Apply.
Then click on the + before - other - and expect your item to be there and displaying data.
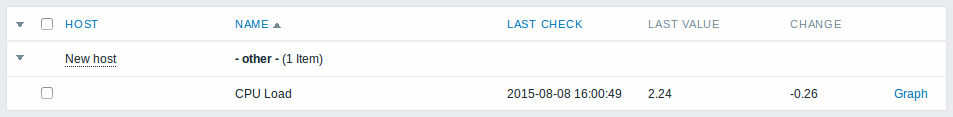
With that said, first data may take up to 60 seconds to arrive. That, by default, is how often the server reads configuration changes and picks up new items to execute.
If you see no value in the 'Change' column, maybe only one value has been received so far. Wait 30 seconds for another value to arrive.
If you do not see information about the item as in the screenshot, make sure that:
- you entered item 'Key' and 'Type of information' fields exactly as in the screenshot
- both agent and server are running
- host status is 'Monitored' and its availability icon is green
- host is selected in the host dropdown, item is active
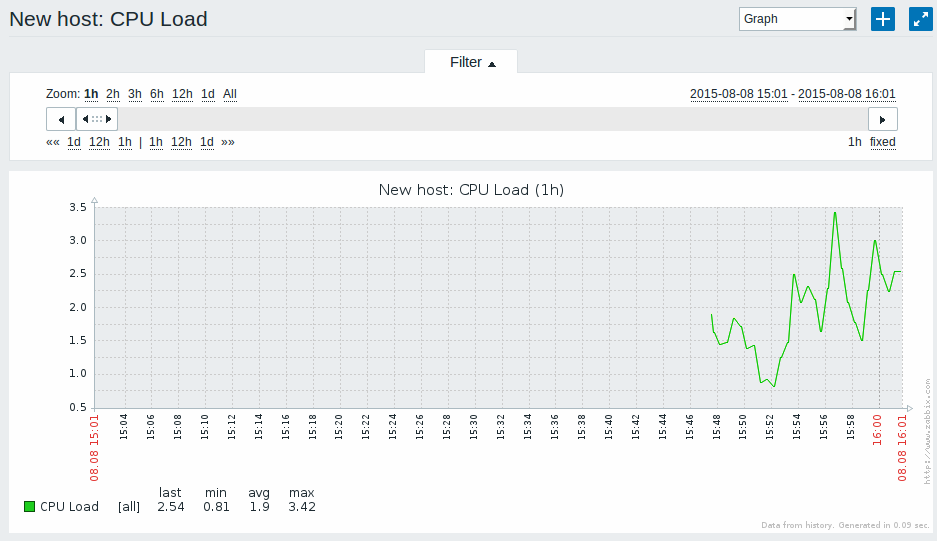
Graphs
With the item working for a while, it might be time to see something visual. Simple graphs are available for any monitored numeric item without any additional configuration. These graphs are generated on runtime.
To view the graph, go to Monitoring → Latest data and click on the 'Graph' link next to the item.