

Table of Contents
1 Dashboard
Visão geral
O módulo Monitoramento → Dashboard é similar a um painel de um carro, apresentando as informações mais importantes.
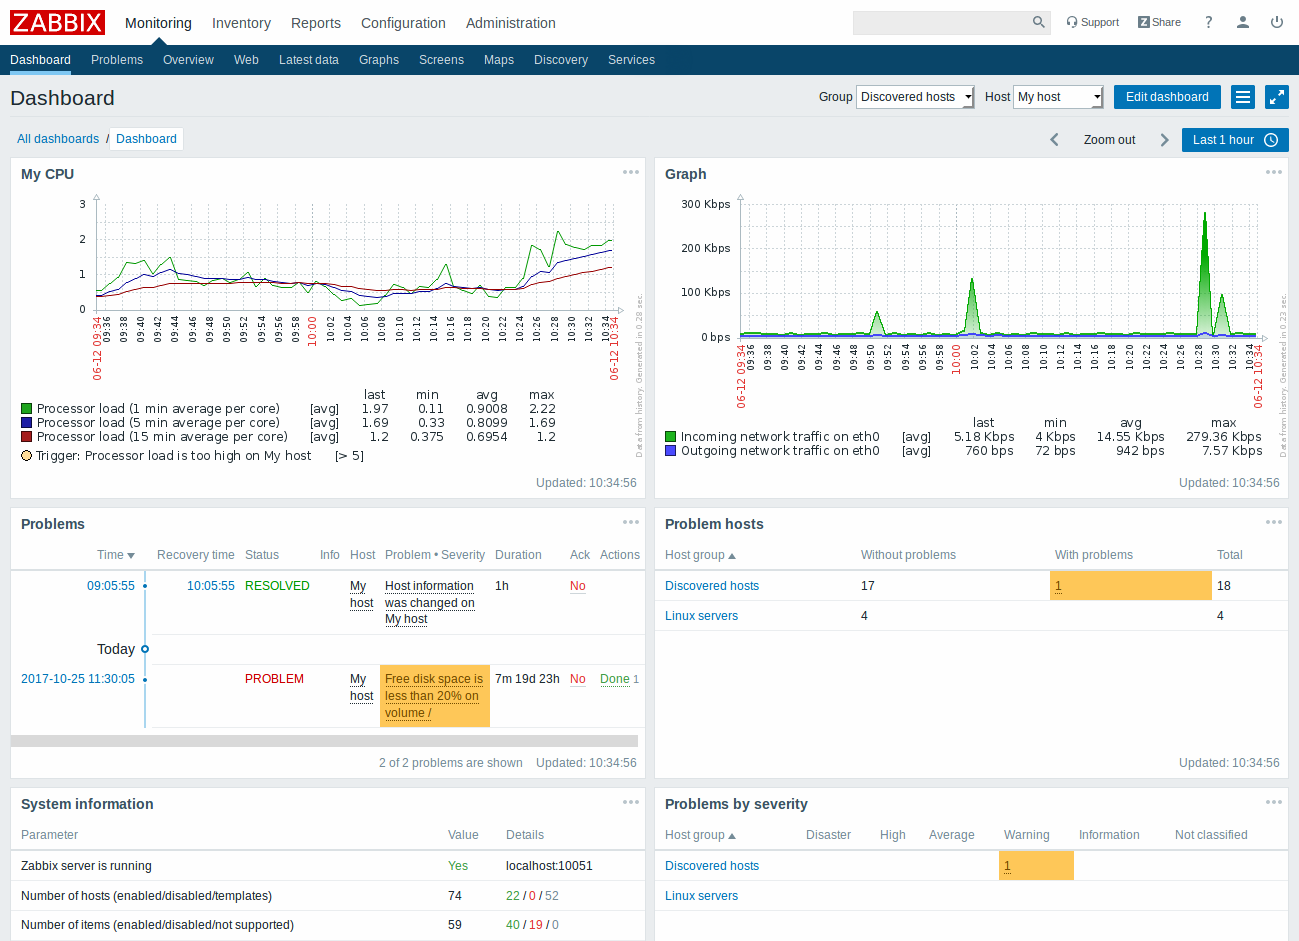
Os widgets do Dashboard podem ser agrupados em dois tipos: Favoritos e de Status. Os favoritos tem por função possibilitar a adição de links para acesso fácil, enquanto os de status tem por função mostrar visões agrupadas de determinado tipo de informação.
Todos eles suportam customização, podendo ser expandidos ou contraídos e ter sua posição modificada no dashboard.
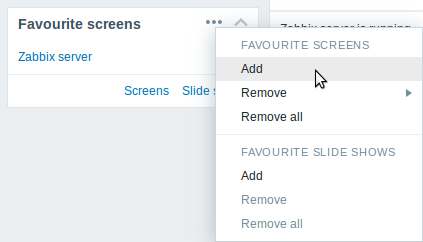
Widgets de favoritos
Temos aqui alguns widgets para itens favoritos que possibilitam a criação de atalhos rápidos para os gráficos, gráficos customizados, apresentações de slides e mapas que você mais usa.
Para adicionar itens a um widget (exemplo para telas):
- Clique no botão menu do widget (botão com reticências)
- Selecione a opção Adicionar do menu flutuante
- Selecione no menu pop-up a(s) tela(s) desejada(s)
- Clique no botão Selecionar
Agora seu widget de telas favoritas tem novos atalhos para acesso fácil às suas telas.
Widgets de status
Existem vários widgets de status:
- Status do Zabbix - Mostra uma visão agrupada do ambiente Zabbix
- Status do sistema - Mostra uma visão agrupada dos incidentes classificados por severidade e grupo
- Status dos hosts - Mostra uma visão agrupada dos incidentes classificados grupo e ocorrência ou não de incidentes ativos
- Últimos 20 incidentes - Mostra os últimos 20 incidentes
- Monitoramento Web - Resumo das monitorações web agrupado por regra e resultado (sucesso / falha)
- Status das regras de autobusca - Resumo das regras de autobusca ativas (se não existir nenhuma regra este widget não aparece)
Dashboard filter
Clique no ícone ![]() na barra de título para ter acesso ao controle de filtros do dashboard.
na barra de título para ter acesso ao controle de filtros do dashboard.
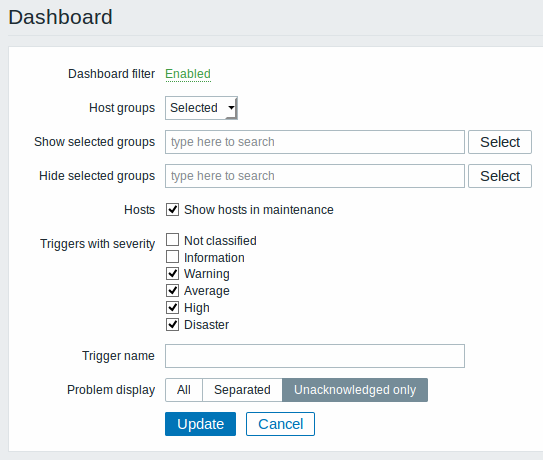
Ao ativar o filtro você pode limitar quais hosts e triggers serão apresentadas no dashboard e definir como os incidentes serão apresentados.
| Parâmetro | Descrição |
|---|---|
| Filtro de dashboard | Marque para ativar o filtro. |
| Grupos de hosts | Selecione para mostrar dados de: Todos - todos os grupos de hosts Selecionados - apenas dos grupos selecionados. |
| Exibir grupos selecionados | Este campo fica disponível quando o campo Grupos de hosts está com a opção Selecionados marcada. Entre com os grupos de hosts para apresentar, este campo possui recurso de auto-completar. Apenas os dados de grupos selecionados estarão visíveis no dashboard, se nenhum for informado todos serão exibidos. |
| Ocultar grupos selecionados | Este campo fica disponível quando o campo Grupos de hosts está com a opção Selecionados marcada. Entre com os grupos de hosts para NÃO EXIBIR, este campo possui recurso de auto-completar. Os grupos de hosts selecionados aqui não estarão visíveis no dashboard. É importante salientar que a ocultação de um grupo pode afetar a exibição de hosts em outros grupos, exemplo: Se os hosts 001, 002, 003 estão no grupo A e os hosts 002, 003 também estão no grupo B. E nós selecionamos para Exibir o grupo A e Esconder o grupo B ao mesmo tempo, apenas os dados do host 001 serão apresentados no dashboard. |
| Hosts | Selecione a opção Mostrar hosts em manutenção para apresentar dados de hosts que estão sob efeito de regras de manutenção programada no Dashboard. |
| Triggers com severidade | Marque as severidades de triggers que você deseja exibir no dashboard. |
| Nome de trigger como | Limite a apresentação de triggers nos widgets: Status do sistema, Status dos Hosts e Últimos 20 incidentes ao filtrar pelo nome das triggers. |
| Exibição de incidentes | Contabilizar os incidentes pela tratativa: Todos - Considera todos os incidentes Separados - incidentes não reconhecidos são contabilizados em separado do total de incidentes Somente não reconhecidos - apenas os incidentes não reconhecidos serão contabilizados. |
Se o filtro Dashboard estiver ativo, o ícone de ajuste de filtro terá um indicador verde para indicar a existência do filtro ativo:  .
.
Dashboard size
The minimum width of a dashboard is 1200 pixels. The dashboard will not shrink below this width; instead a horizontal scrollbar is displayed if the browser window is smaller than that.
The maximum width of a dashboard is the browser window width. Dashboard widgets stretch horizontally to fit the window. At the same time, a dashboard widget cannot be stratched horizontally beyond the window limits.
Technically the dashboard consists of 12 horizontal columns of always equal width that stretch/shrink dynamically (but not to less than 1200 pixels total).
Vertically the dashboard may contain a maximum of 64 rows. Each row has a fixed height of 70 pixels. A widget may be up to 32 rows high.
Menu flutuante host
Ao clicar em um host no widget dos Últimos 20 incidentes será apresentado o menu flutuante do host. Este menu inclui links para scripts customizados, dados recentes, triggers, inventário, gráficos e telas daquele host.
O menu de host é acessível ao clicar em um host em diversos locais:
- Monitoramento → Visão geral (na célula do host)
- Monitoramento → Dados recentes (ao clicar no nome do host)
- Monitoramento → Triggers (ao clicar no nome do host)
- Monitoramento → Eventos (ao clicar no nome do host)
- Monitoramento → Eventos → Detalhes do evento (ao clicar no nome do host)
- Monitoramento → Telas (nos widgets de Incidentes do Host e Incidentes do grupo de host)
- Monitoramento → Mapas (ao clicar no ícone associado ao host)
- Relatórios → Top 100 de triggers
Menu flutuante de triggers
Clicando no Incidente apresentado no widget dos Últimos 20 incidentes será apresentado o menu flutuante de triggers e eventos. Ele contêm a lista de eventos e, se definido, a descrição da trigger e uma URL clicável.
Creating a dashboard
It is possible to create a new dashboard in two ways:
- Click on Create dashboard, when viewing all dashboards
- Select Create new from the action menu, when viewing a single dashboard
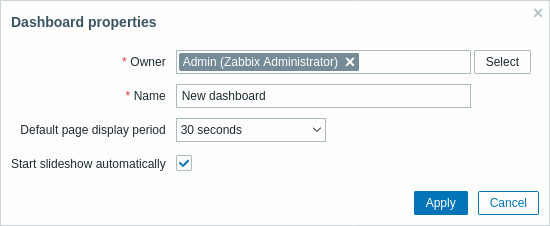
You will be first asked to enter general dashboard parameters:
| Parameter | Description |
|---|---|
| Owner | Select system user that will be the dashboard owner. |
| Name | Enter dashboard name. |
| Default page display period | Select period for how long a dashboard page is displayed before rotating to the next page in a slideshow. |
| Start slideshow automatically | Mark this checkbox to run a slideshow automatically one more than one dashboard page exists. |
When you click on Apply, an empty dashboard is opened:
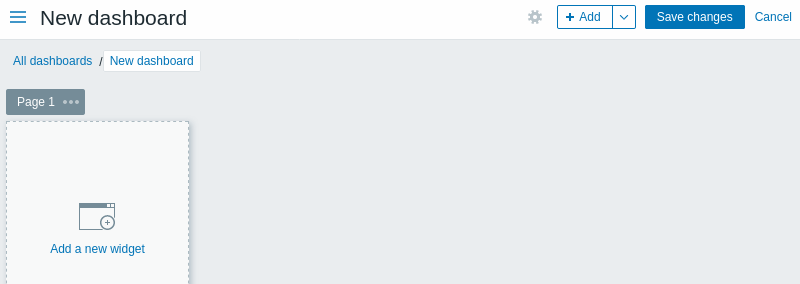
To populate the dashboard, you can add widgets and pages.
Click on the Save changes button to save the dashboard. If you click on Cancel, the dashboard will not be created.
Adicionando widgets
Para adicionar um widget a um painel:
- Clique no
 botão ou a opção Adicionar widget no menu de ação que pode ser aberto clicando na seta. Preencha o formulário de configuração do widget. O widget será criado em seu tamanho padrão e colocado após o widgets existentes (se houver);
Ou
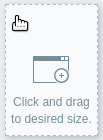
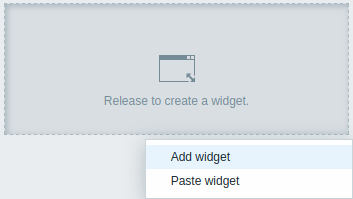
- Mova o mouse para o local vazio desejado para o novo widget. Perceber como um espaço reservado aparece, ao passar o mouse, em qualquer slot vazio no painel de controle. Em seguida, clique para abrir o formulário de configuração do widget. Depois de preenchendo o formulário o widget será criado em seu tamanho padrão ou, se o tamanho padrão for maior do que o disponível, pegue o espaço disponível. Alternativamente, você pode clicar e arrastar o espaço reservado para o tamanho de widget desejado, solte e preencha o formulário de configuração do widget. (Observe que quando há um widget copiado para a área de transferência, primeiro você será solicitado a selecionar entre as opções Adicionar widget e Colar widget para criar um widget.)
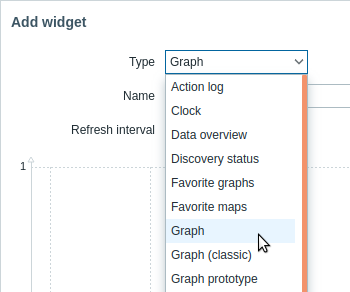
No formulário de configuração do widget:
- Selecione o Tipo de widget
- Insira os parâmetros do widget
- Clique em Adicionar
Widgets
Os seguintes widgets podem ser adicionados a um painel:
- Açao log
- Relógio
- Dados visão geral
- Descoberta status
- Favorito gráficos
- Favorito mapas
- Geomap
- Gráfico
- Gráfico (clássico)
- Gráfico protótipo
- Hospedeiro disponibilidade
- Valor do item
- Mapa
- Navegação no mapa tree
- Simples text
- Problema hosts
- Problemas
- Sistema informações
- Problemas por gravidade
- Principais hosts
- Acionar visão geral
- URL
- Rede monitoramento
No modo de edição do painel, os widgets podem ser redimensionados e movidos painel clicando na barra de título do widget e arrastando-o para um novo localização. Além disso, você pode clicar nos seguintes botões no canto superior direito canto do widget para:
 - editar um widget;
 - acesse o menu widget
Clique em Salvar alterações para que o painel faça as alterações no widgets permanentes.
Copying/pasting widgets
Dashboard widgets can be copied and pasted, allowing to create a new widget with the properties of an existing one. They can be copy-pasted within the same dashboard, or between dashboards opened in different tabs.
A widget can be copied using the widget menu. To paste the widget:
- click on the arrow next to the Add button and selecting the Paste widget option, when editing the dashboard
- use the Paste widget option when adding a new widget by selecting some area in the dashboard (a widget must be copied first for the paste option to become available)
A copied widget can be used to paste over an existing widget using the Paste option in the widget menu.
Creating a slideshow
A slideshow will run automatically if the dashboard contains two or more pages (see Adding pages) and if one of the following is true:
- The Start slideshow automatically option is marked in dashboard properties
- The dashboard URL contains a
slideshow=1parameter
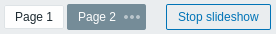
The pages rotate according to the intervals given in the properties of the dashboard and individual pages. Click on:
- Stop slideshow - to stop the slideshow
- Start slideshow - to start the slideshow
Slideshow-related controls are also available in kiosk mode (where only the page content is shown):
 - stop slideshow
 - start slideshow
 - go back one page
 - go to the next page
Adding pages
To add a new page to a dashboard:
- Make sure the dashboard is in the editing mode
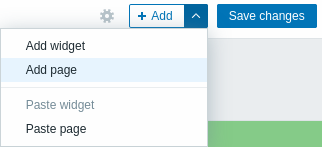
- Click on the arrow next to the Add button and select the Add page option
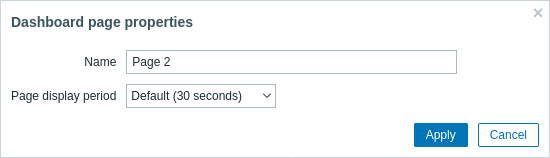
- Fill the general page parameters and click on Apply. If you leave the name empty, the page will be added with a
Page Nname where 'N' is the incremental number of the page. The page display period allows to customize how long a page is displayed in a slideshow.
A new page will be added, indicated by a new tab (Page 2).
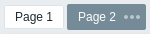
The pages can be reordered by dragging-and-dropping the page tabs. Reordering maintains the original page naming. It is always possible to go to each page by clicking on its tab.
When a new page is added, it is empty. You can add widgets to it as described above.
Copying/pasting pages
Dashboard pages can be copied and pasted, allowing to create a new page with the properties of an existing one. They can be pasted from the same dashboard or a different dashboard.
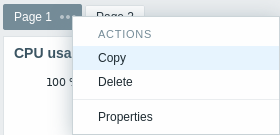
To paste an existing page to the dashboard, first copy it, using the page menu:
To paste the copied page:
- Make sure the dashboard is in the editing mode
- Click on the arrow next to the Add button and select the Paste page option
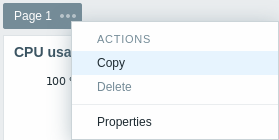
Page menu
The page menu can be opened by clicking on the three dots  next to the page name:
It contains the following options:
- Copy - copy the page
- Delete - delete the page (pages can only be deleted in the dashboard editing mode)
- Properties - customize the page parameters (the name and the page display period in a slideshow)
Widget menu
The widget menu contains different options based on whether the dashboard is in the edit or view mode:
| Widget menu | Options |
|---|---|
In dashboard edit mode: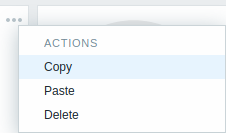 |
Copy - copy the widget Paste - paste a copied widget over this widget This option is grayed out if no widget has been copied. Delete - delete the widget |
In dashboard view mode: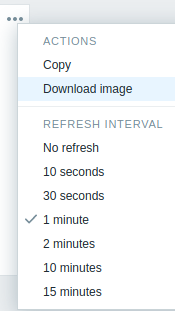 |
Copy - copy the widget Download image - download the widget as a PNG image (only available for graph/classic graph widgets) Refresh interval - select the frequency of refreshing the widget contents |
Dynamic widgets
When configuring some of the widgets:
- Graphs (simple and custom)
- Plain text
- URL
there is an extra option called Dynamic item. You can check this box to make the widget dynamic - i.e. capable of displaying different content based on the selected host.
Now, when saving the dashboard, you will notice that a new host selection field has appeared atop the dashboard for selecting the host (while the Select button allows selecting the host group in a popup):

Thus you have a widget, which can display content that is based on the data from the host that is selected. The benefit of this is that you do not need to create extra widgets just because, for example, you want to see the same graphs containing data from various hosts.
Permissions to dashboards
Permissions to dashboards for regular users and users of 'Admin' type are limited in the following way:
- They can see and clone a dashboard if they have at least READ rights to it;
- They can edit and delete dashboard only if they have READ/WRITE rights to it;
- They cannot change the dashboard owner.
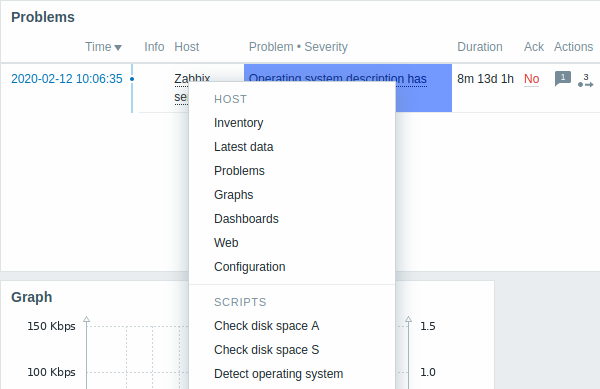
Host menu
Clicking on a host in the Problems widget brings up the host menu. It includes links to host inventory, latest data, problems, graphs, dashboards, web scenarios and configuration. Note that host configuration is available for Admin and Superadmin users only.
Global scripts can also be run from the host menu. These scripts need to have their scope defined as 'Manual host action' to be available in the host menu.
The host menu is accessible by clicking on a host in several other frontend sections:
- Monitoring → Problems
- Monitoring → Problems → Event details
- Monitoring → Hosts
- Monitoring → Hosts → Web Monitoring
- Monitoring → Latest data
- Monitoring → Maps
- Reports → Triggers top 100
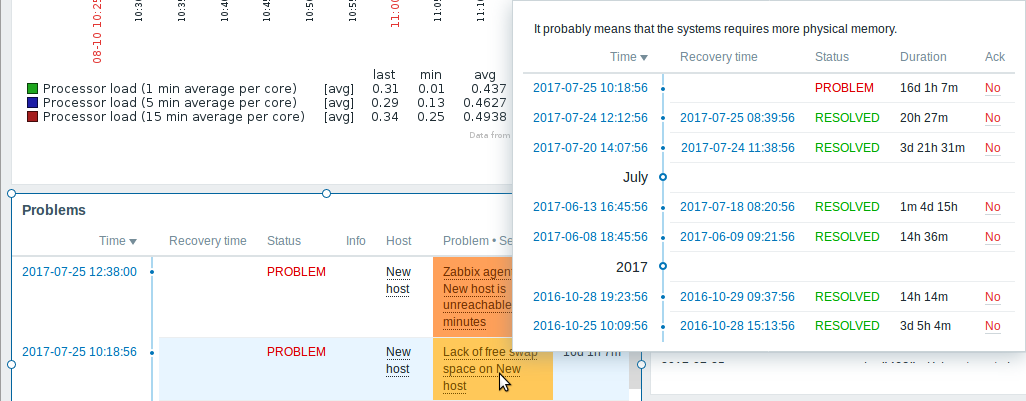
Problem event popup
The problem event popup includes the list of problem events for this trigger and, if defined, the trigger description and a clickable URL.
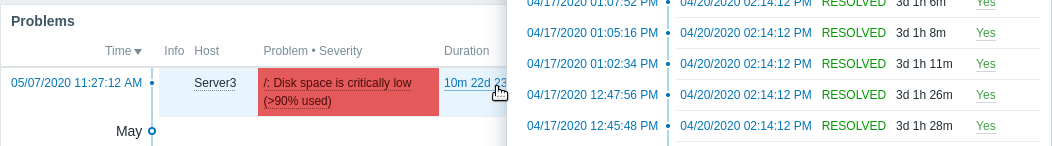
To bring up the problem event popup:
- roll a mouse over the problem duration in the Duration column of the Problems widget. The popup disappears once you remove the mouse from the duration.
- click on the duration in the Duration column of the Problems widget. The popup disappears only if you click on the duration again.
Resolved values of {ITEM.VALUE} and {ITEM.LASTVALUE} macros in trigger descriptions are truncated to 20 characters. To see the entire values you may use macro functions with these macros, e.g. {{ITEM.VALUE}.regsub("(.*)", \1)}, {{ITEM.LASTVALUE}.regsub("(.*)", \1)} as a workaround.