Documentation


Table of Contents
1 Графики
Обзор
Доступ к графикам узла сети можно получить из раздела Мониторинг → Узлы сети, нажав на ссылку Графики в строке соответствующего узла сети. Любой пользовательский график из настроеных для узла сети может быть отображен, однако, одновременно может отображаться не более 20 графиков.
Параметр Просмотр как (в правом верхнем углу) позволяет выбрать как будут отображаться данные: графически или в виде значений. Графики для отключенных узлов сети также доступны.
Выбор периода времени
Обратите внимание на селектор периода времени выше графика. Он позволяет выбрать часто требуемые периоды за одно нажатие.
Смотрите также: Селектор периода времени
Использование фильтра
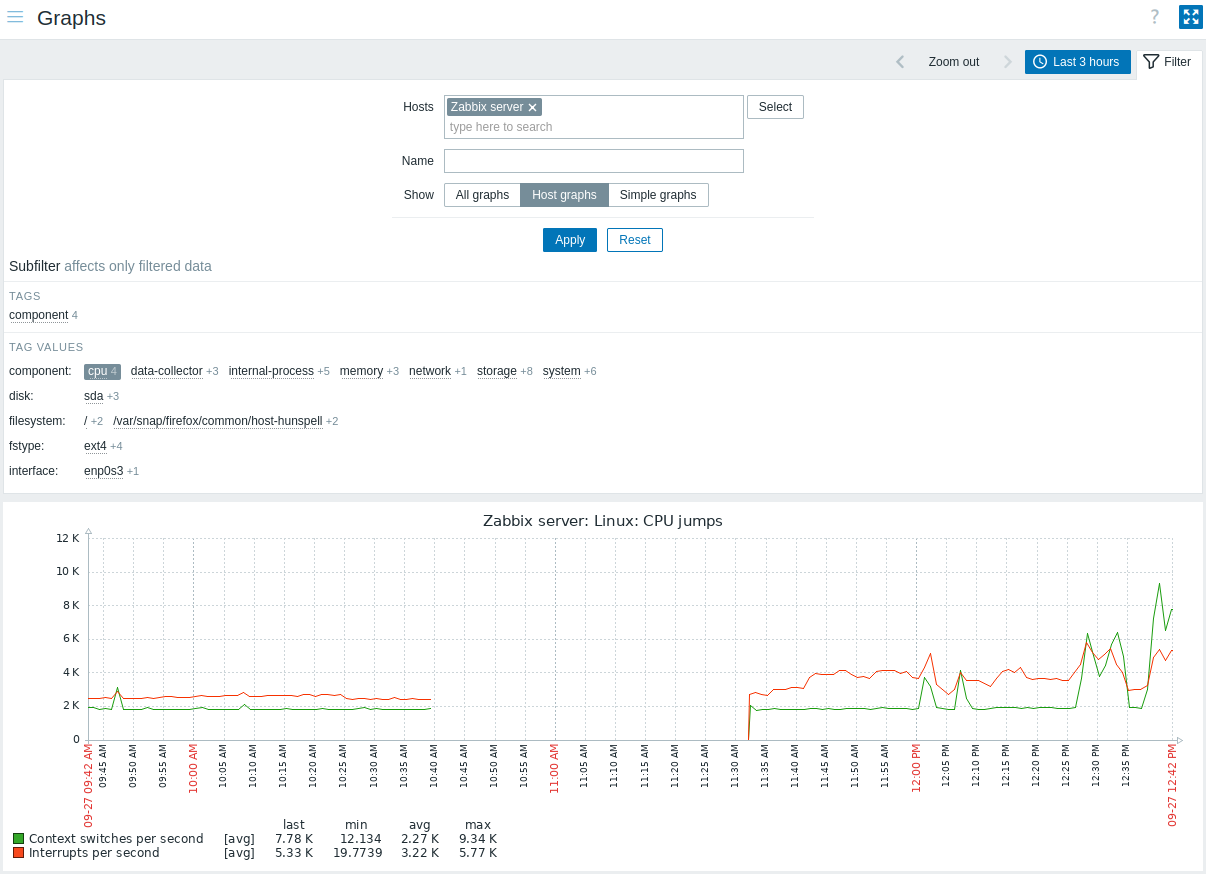
Чтобы просмотреть конкретный график, выберите его в фильтре. Фильтр позволяет выбрать один узел сети за раз (это поле является обязательным), а затем указать графики данного узла сети либо выбирая из списка, либо с помощью поиска по шаблону имени графика.
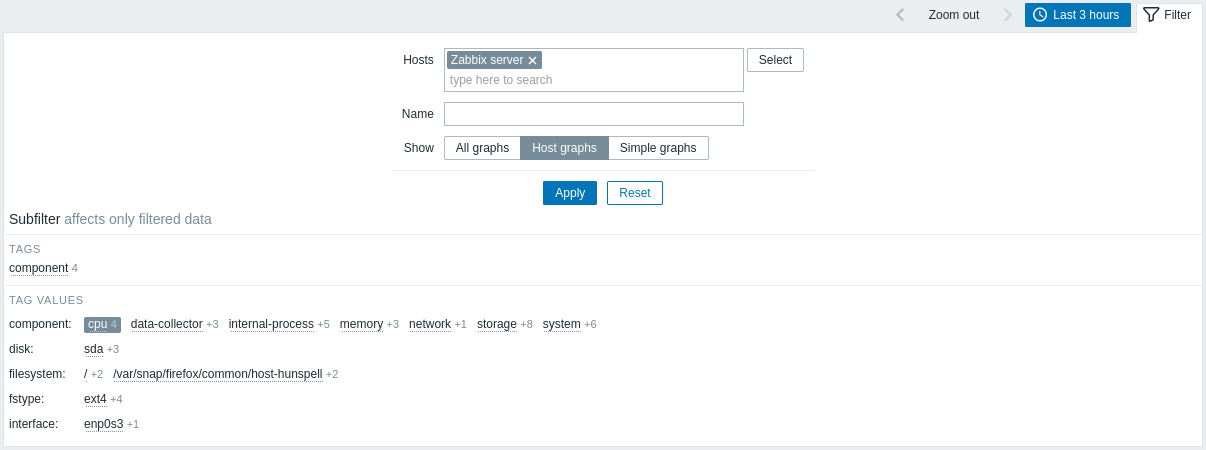
Using subfilter
The subfilter is useful for a quick one-click access to related graphs. The subfilter operates autonomously from the main filter - results are filtered immediately, no need to click on Apply in the main filter.
Note that the subfilter only allows to further modify the filtering from the main filter.
Unlike the main filter, the subfilter is updated together with each table refresh request to always get up-to-date information of available filtering options and their counter numbers.
The subfilter shows clickable links allowing to filter graphs based on a common entity - the tag name or tag value. As soon as the entity is clicked, graphs are immediately filtered; the selected entity is highlighted with gray background. To remove the filtering, click on the entity again. To add another entity to the filtered results, click on another entity.
The number of entities displayed is limited to 100 horizontally. If there are more, a three-dot icon is displayed at the end; it is not clickable. Vertical lists (such as tags with their values) are limited to 20 entries. If there are more, a three-dot icon is displayed; it is not clickable.
A number next to each clickable entity indicates the number of graphs it has in the results of the main filter.
Once one entity is selected, the numbers with other available entities are displayed with a plus sign indicating how many graphs may be added to the current selection.
Кнопки
Кнопки режима просмотра, являющиеся общими для всех разделов, описаны на странице Мониторинг.