
Telemetry query
This item type lets you retrieve or aggregate telemetry data. Telemetry data is used for application performance monitoring (APM), which helps you see how requests flow through your applications and services, measure their performance, and find the cause of slow or failed operations.
Telemetry data comes in three types: traces (the path that a request takes through your applications and services), metrics (measurements, such as response time), and logs (text records of events). By using the telemetry query item, you can, for example, find all traces where a service returned an error, get the average response time from your metrics, or search your logs for a specific error message.
When you configure a telemetry query item, you define a set of instructions (a query) that tells Zabbix which telemetry data to ask for, how to filter it, and how to aggregate it. When the item check is executed, Zabbix sends this query to the telemetry data source and retrieves the result based on the query.
To use this item, specify the telemetry data source and set the StartTelemetryQueryPollers parameter in the Zabbix server or Zabbix proxy configuration, depending on which of them monitors the item's host.
Configuration
When creating an item, set its type to Telemetry query:
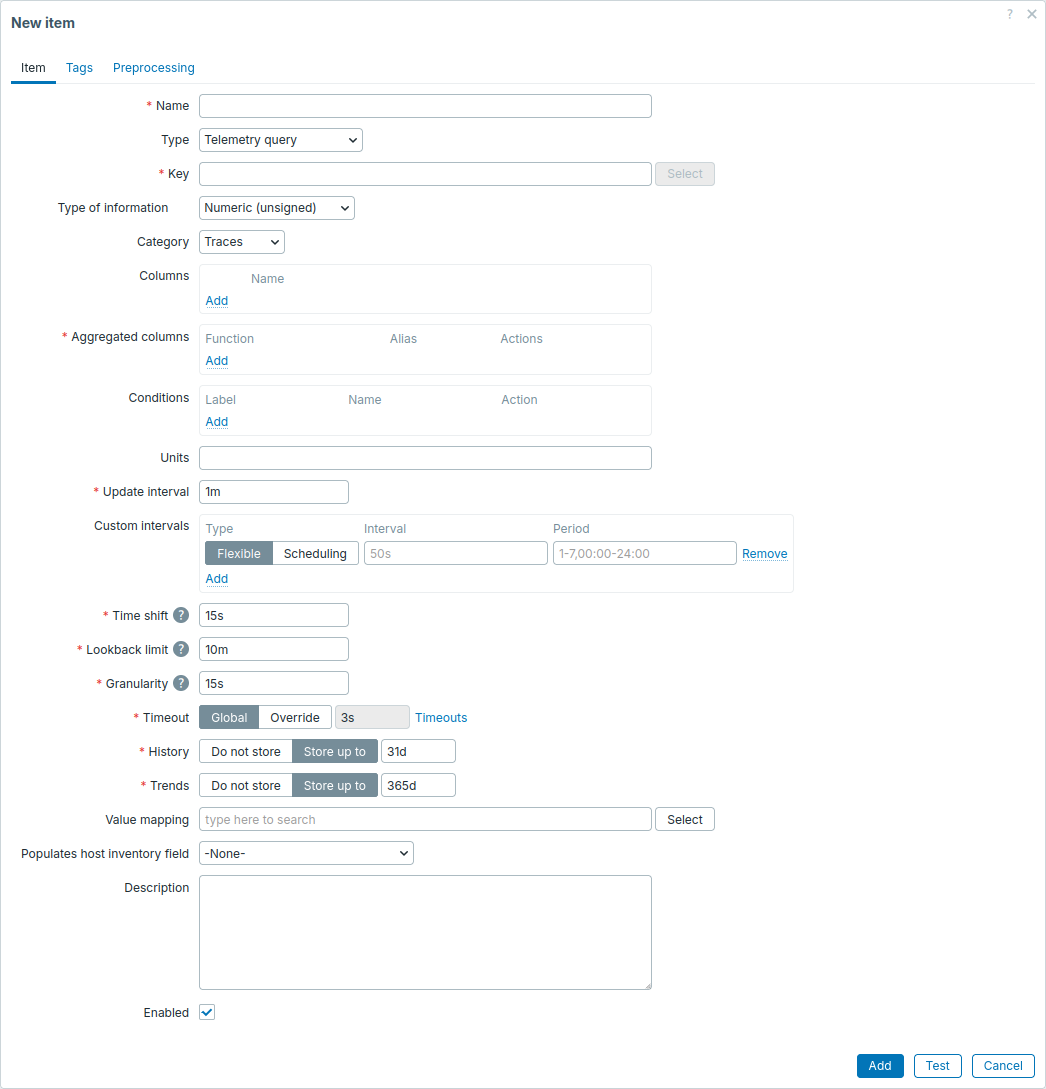
| Parameter | Description |
|---|---|
| Name | See parameters common to all items. |
| Type | Select Telemetry query. |
| Key | See parameters common to all items. |
| Type of information | |
| Category | Select the signal type that you want to query: Traces, Metrics, or Logs. |
| Metric points | Select the metric point type that you want to query: Sum, Gauge, Histogram, or Exponential histogram. This parameter is available if Category is set to Metrics. |
| Columns | Add telemetry data columns that you want to query. For columns that hold key-value pairs, also enter the key name. The records from these columns will be included in the item value as is. |
| Aggregated columns | Add telemetry data columns that you want to query, and how to calculate a value from their records: Function - select the function to apply to the column records: min, max, avg, count, sum, or percentile. Percentage - enter the percentile to calculate from the column records (if Function is set to percentile). Column - select the column to calculate from (if Function is not set to count). Alias - enter a unique name for the calculated value, used to identify it in the item value. |
| Type of calculation | Select how to evaluate the conditions set in the Conditions parameter below: And/Or - all conditions must be met; conditions with the same Type and Attribute key are combined with Or. And - all conditions must be met. Or - at least one condition must be met. Custom expression - conditions must be met as specified in the formula, for example, A and (B or C).This parameter is available if you have set two or more conditions. |
| Conditions | Add conditions for filtering telemetry data column records: Type - select the telemetry data column that the condition will apply to. Attribute key - enter the key that the condition will apply to (if Type is set to a column with key-value pairs). Operator - select the comparison to use (see below) between the record's value and Attribute value. Attribute value - enter the value to compare the record's value against (if Operator is not set to Exists). If Type is set to a single-value column, the condition will apply to the column's record; if the column holds an array of values, the condition will match the record if at least one value in the array meets the condition. If Type is set to a column that holds key-value pairs, the condition will apply to the value of the key specified in Attribute key; if the column holds an array of key-value pairs, the condition will match the record if at least one pair with the specified Attribute key meets the condition. For single-value columns, you can use these operators: Equals - match records that equal Attribute value (case-sensitive). Does not equal - match records that do not equal Attribute value (case-sensitive). Contains - match records that contain Attribute value (case-sensitive). Does not contain - match records that do not contain Attribute value (case-sensitive). For columns that hold key-value pairs, you can use these operators: Equals - match records where Attribute key exists and its value equals Attribute value (case-sensitive). Does not equal - match records where Attribute key exists and its value does not equal Attribute value (case-sensitive). Exists - match records where Attribute key exists (case-sensitive). |
| Units | See parameters common to all items. |
| Update interval | |
| Custom intervals | |
| Time shift | Enter the minimum time between the end of the query time range and the current time. Supports a number of seconds (e.g., 1, 60, 300), a value with a time suffix (e.g., 30s, 1m, 2h, 1d), or user macros. |
| Lookback limit | Enter how far back (before the end of the query time range) to start the query time range if: - There is no previous query to continue from (e.g., on the item's first run). - Continuing from the previous query would make the query time range longer than Lookback limit (e.g., because Zabbix server was down). Supports a number of seconds (e.g., 1, 60, 300), a value with a time suffix (e.g., 30s, 1m, 2h, 1d), or user macros.If this item's host becomes monitored by a different entity (e.g., a different proxy from a proxy group), the item may no longer know when the previous query ended. This can cause duplicate values. |
| Granularity | Enter the length of a bucket that the query time range is split into. Supports a number of seconds (e.g., 1, 60, 300), a value with a time suffix (e.g., 30s, 1m, 2h, 1d), or user macros.The value cannot be longer than Lookback limit. |
| Timeout | See parameters common to all items. |
| History | |
| Trends | |
| Value mapping | |
| Populates host inventory field | |
| Description | |
| Enabled |
Query time range
When a telemetry query item check is executed, the item queries data for a specific time range:
- The query time range usually starts where the previous query's time range ended (with exceptions, see examples below).
- The query time range ends at most Time shift before the current time.
- The query time range is split into buckets of Granularity length (it contains only whole buckets; remaining time is queried after).
Depending on the parameter values, the query time ranges of consecutive item checks can follow each other (tumbling aggregation), overlap (hopping aggregation), or leave gaps (hopping aggregation with gaps). The examples below assume that item checks are executed on time, every Update interval. Delayed or manually executed checks may leave gaps or overlaps.
Tumbling aggregation occurs if Update interval is not shorter than Granularity and not longer than Lookback limit.
For example, with Update interval set to 1m, Time shift to 15s, Lookback limit to 10m, and Granularity to 15s, each query time range is 1 minute long and split into four 15-second buckets:
                                                   Time shift (15s)        Time shift (15s)
      11:58:00                11:59:00             |  12:00:00 (Check 1)   |  12:01:00 (Check 2)
      ↓                       ↓                    ↓  ↓                    ↓  ↓
| 15s | 15s | 15s | 15s | 15s | 15s | 15s | 15s | 15s | 15s | 15s | 15s | 15s | 15s |
                        |<------ Range 1 ------>|<------ Range 2 ------>|
Hopping aggregation occurs if Granularity is longer than Update interval.
For example, with Update interval set to 1m, Time shift to 15s, Lookback limit to 10m, and Granularity to 2m, each query time range is 2 minutes long (one bucket) and overlaps with the previous one by 1 minute:
                                                   Time shift (15s)        Time shift (15s)
      11:58:00                11:59:00             |  12:00:00 (Check 1)   |  12:01:00 (Check 2)
      ↓                       ↓                    ↓  ↓                    ↓  ↓
| 15s | 15s | 15s | 15s | 15s | 15s | 15s | 15s | 15s | 15s | 15s | 15s | 15s | 15s |
|<------------------ Range 1 ------------------>|                       |
                        |<------------------ Range 2 ------------------>|
Hopping aggregation with gaps occurs if Update interval is longer than Lookback limit.
For example, with Update interval set to 1m, Time shift to 15s, Lookback limit to 45s, and Granularity to 15s, each query time range is 45 seconds long (three buckets) and leaves a 15-second gap after the previous one:
                                                   Time shift (15s)        Time shift (15s)
      11:58:00                11:59:00             |  12:00:00 (Check 1)   |  12:01:00 (Check 2)
      ↓                       ↓                    ↓  ↓                    ↓  ↓
| 15s | 15s | 15s | 15s | 15s | 15s | 15s | 15s | 15s | 15s | 15s | 15s | 15s | 15s |
                              |<--- Range 1 --->|     |<--- Range 2 --->|
When configuring the query time range, consider the following:
- In most cases, set Update interval, Lookback limit, and Granularity to the same value (e.g.,
1m). Equal Lookback limit and Granularity make each check query a single bucket, and an equal Update interval makes consecutive query time ranges follow each other without overlaps or gaps. - Set Time shift to cover the delay before telemetry data is written to the data source. Otherwise, the item may query a time range before all of its data is written, and the missing data may not be queried again.
- Set Lookback limit longer than Update interval only if the item must query the data it missed (e.g., while Zabbix server was down). A longer Lookback limit may reduce performance when the item uses it, especially when the telemetry data source holds a large amount of data (e.g., over a million records per hour).
Supported telemetry data columns
This section lists the columns supported in these item parameters: Columns, Aggregated columns, and Conditions. These are the columns used by ClickHouse to store telemetry data, following the OpenTelemetry ClickHouse exporter schema.
Select the Category:
Traces
| Column | Columns | Aggregated columns | Conditions |
|---|---|---|---|
| Duration | ✓ | ✓ | – |
| Events.Attributes | – | – | ✓ |
| Events.Name | – | – | ✓ |
| ParentSpanId | ✓ | – | ✓ |
| ResourceAttributes | ✓ | – | ✓ |
| ScopeName | ✓ | – | ✓ |
| ScopeVersion | ✓ | – | ✓ |
| ServiceName | ✓ | – | ✓ |
| SpanAttributes | ✓ | – | ✓ |
| SpanId | ✓ | – | ✓ |
| SpanKind | ✓ | – | ✓ |
| SpanName | ✓ | – | ✓ |
| StatusCode | ✓ | – | ✓ |
| StatusMessage | ✓ | – | ✓ |
| Timestamp | ✓ | ✓ | – |
| TraceId | ✓ | – | ✓ |
| TraceState | ✓ | – | ✓ |
Metrics: Sum
| Column | Columns | Aggregated columns | Conditions |
|---|---|---|---|
| AggregationTemporality | ✓ | – | – |
| Attributes | ✓ | – | ✓ |
| Exemplars.FilteredAttributes | – | – | ✓ |
| Flags | ✓ | – | – |
| IsMonotonic | ✓ | – | – |
| MetricDescription | ✓ | – | ✓ |
| MetricName | ✓ | – | ✓ |
| MetricUnit | ✓ | – | ✓ |
| ResourceAttributes | ✓ | – | ✓ |
| ResourceSchemaUrl | ✓ | – | ✓ |
| ScopeAttributes | ✓ | – | ✓ |
| ScopeDroppedAttrCount | ✓ | ✓ | – |
| ScopeName | ✓ | – | ✓ |
| ScopeSchemaUrl | ✓ | – | ✓ |
| ScopeVersion | ✓ | – | ✓ |
| ServiceName | ✓ | – | ✓ |
| StartTimeUnix | ✓ | ✓ | – |
| TimeUnix | ✓ | ✓ | – |
| Value | ✓ | ✓ | – |
Metrics: Gauge
| Column | Columns | Aggregated columns | Conditions |
|---|---|---|---|
| Attributes | ✓ | – | ✓ |
| Exemplars.FilteredAttributes | – | – | ✓ |
| Flags | ✓ | – | – |
| MetricDescription | ✓ | – | ✓ |
| MetricName | ✓ | – | ✓ |
| MetricUnit | ✓ | – | ✓ |
| ResourceAttributes | ✓ | – | ✓ |
| ResourceSchemaUrl | ✓ | – | ✓ |
| ScopeAttributes | ✓ | – | ✓ |
| ScopeDroppedAttrCount | ✓ | ✓ | – |
| ScopeName | ✓ | – | ✓ |
| ScopeSchemaUrl | ✓ | – | ✓ |
| ScopeVersion | ✓ | – | ✓ |
| ServiceName | ✓ | – | ✓ |
| StartTimeUnix | ✓ | ✓ | – |
| TimeUnix | ✓ | ✓ | – |
| Value | ✓ | ✓ | – |
Metrics: Histogram
| Column | Columns | Aggregated columns | Conditions |
|---|---|---|---|
| AggregationTemporality | ✓ | – | – |
| Attributes | ✓ | – | ✓ |
| Count | ✓ | ✓ | – |
| Exemplars.FilteredAttributes | – | – | ✓ |
| Flags | ✓ | – | – |
| Max | ✓ | ✓ | – |
| MetricDescription | ✓ | – | ✓ |
| MetricName | ✓ | – | ✓ |
| MetricUnit | ✓ | – | ✓ |
| Min | ✓ | ✓ | – |
| ResourceAttributes | ✓ | – | ✓ |
| ResourceSchemaUrl | ✓ | – | ✓ |
| ScopeAttributes | ✓ | – | ✓ |
| ScopeDroppedAttrCount | ✓ | ✓ | – |
| ScopeName | ✓ | – | ✓ |
| ScopeSchemaUrl | ✓ | – | ✓ |
| ScopeVersion | ✓ | – | ✓ |
| ServiceName | ✓ | – | ✓ |
| StartTimeUnix | ✓ | ✓ | – |
| Sum | ✓ | ✓ | – |
| TimeUnix | ✓ | ✓ | – |
Metrics: Exponential histogram
| Column | Columns | Aggregated columns | Conditions |
|---|---|---|---|
| AggregationTemporality | ✓ | – | – |
| Attributes | ✓ | – | ✓ |
| Count | ✓ | ✓ | – |
| Exemplars.FilteredAttributes | – | – | ✓ |
| Flags | ✓ | – | – |
| Max | ✓ | ✓ | – |
| MetricDescription | ✓ | – | ✓ |
| MetricName | ✓ | – | ✓ |
| MetricUnit | ✓ | – | ✓ |
| Min | ✓ | ✓ | – |
| NegativeOffset | ✓ | ✓ | – |
| PositiveOffset | ✓ | ✓ | – |
| ResourceAttributes | ✓ | – | ✓ |
| ResourceSchemaUrl | ✓ | – | ✓ |
| Scale | ✓ | ✓ | – |
| ScopeAttributes | ✓ | – | ✓ |
| ScopeDroppedAttrCount | ✓ | ✓ | – |
| ScopeName | ✓ | – | ✓ |
| ScopeSchemaUrl | ✓ | – | ✓ |
| ScopeVersion | ✓ | – | ✓ |
| ServiceName | ✓ | – | ✓ |
| StartTimeUnix | ✓ | ✓ | – |
| Sum | ✓ | ✓ | – |
| TimeUnix | ✓ | ✓ | – |
| ZeroCount | ✓ | ✓ | – |
Logs
| Column | Columns | Aggregated columns | Conditions |
|---|---|---|---|
| Body | ✓ | – | ✓ |
| EventName | ✓ | – | ✓ |
| LogAttributes | ✓ | – | ✓ |
| ResourceAttributes | ✓ | – | ✓ |
| ResourceSchemaUrl | ✓ | – | ✓ |
| ScopeAttributes | ✓ | – | ✓ |
| ScopeName | ✓ | – | ✓ |
| ScopeSchemaUrl | ✓ | – | ✓ |
| ScopeVersion | ✓ | – | ✓ |
| SpanId | ✓ | – | ✓ |
| ServiceName | ✓ | – | ✓ |
| SeverityNumber | ✓ | ✓ | – |
| SeverityText | ✓ | – | ✓ |
| Timestamp | ✓ | ✓ | – |
| TraceFlags | ✓ | – | – |
| TraceId | ✓ | – | ✓ |