

Table of Contents
3 Availability report
Overview
In Reports → Availability report you can see what proportion of time each trigger has been in problem/ok state. The percentage of time for each state is displayed.
Thus it is easy to determine the availability situation of various elements on your system.
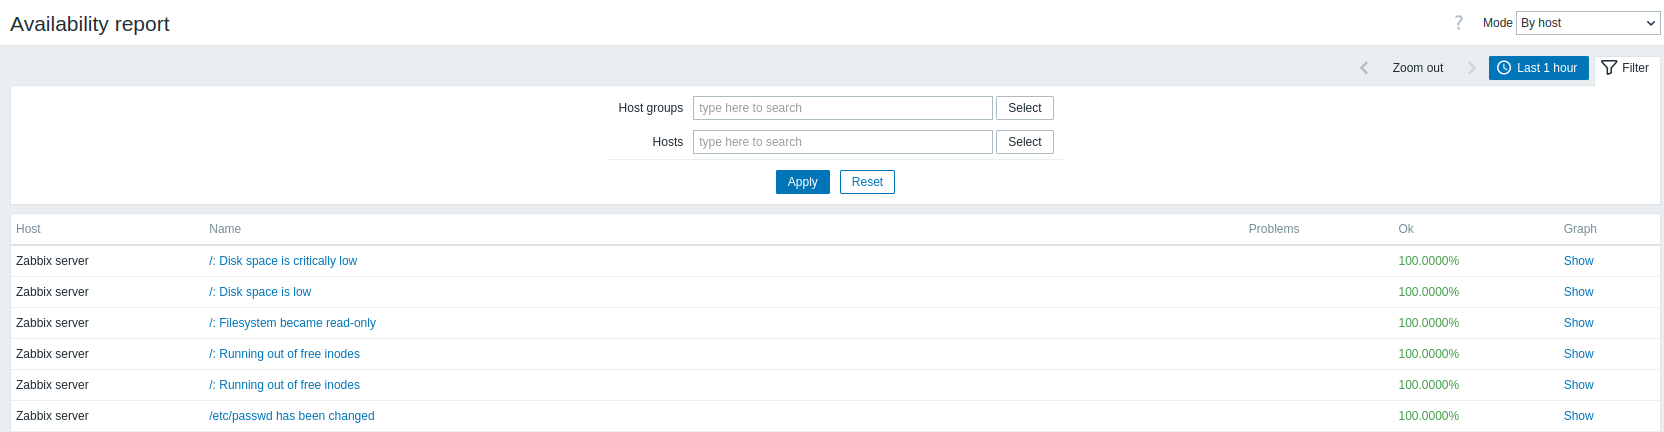
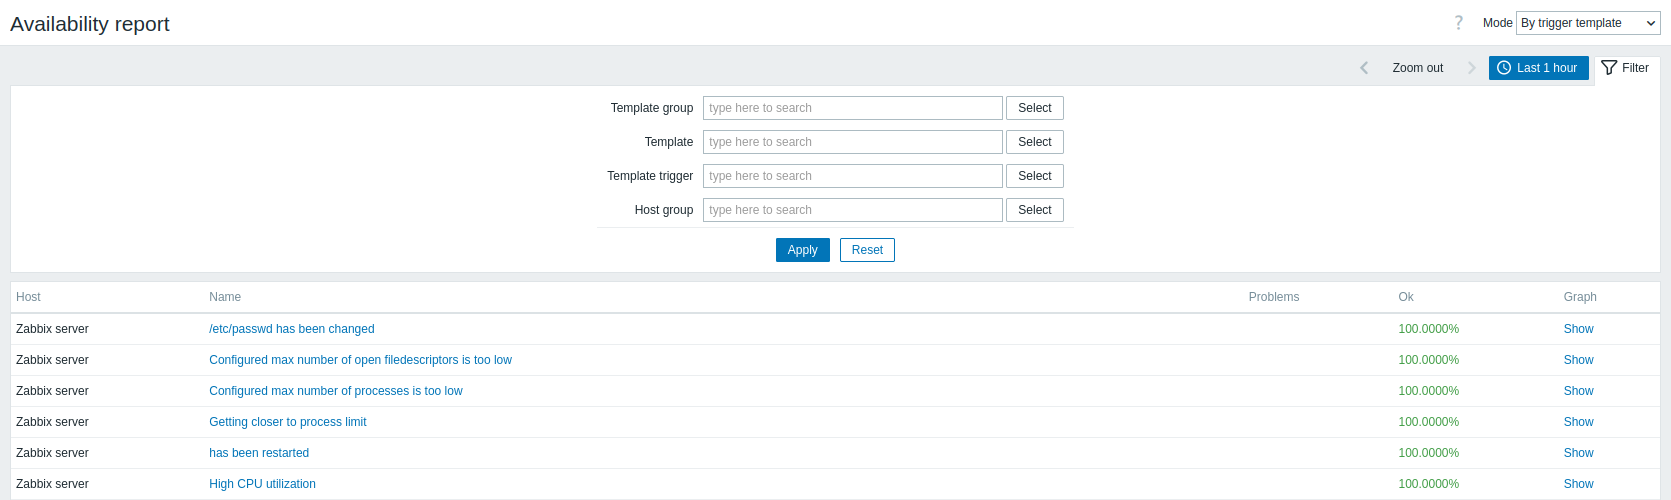
From the drop-down in the upper right corner, you can choose the selection mode - whether to display triggers by hosts or by triggers belonging to a template.
The name of the trigger is a link to the latest events of that trigger.
Using filter
The filter can help narrow down the number of hosts and/or triggers displayed. For better search performance, data is searched with macros unresolved.
The filter is located below the Availability report bar. It can be opened and collapsed by clicking on the Filter tab on the right.
Filtering by trigger template
In the By trigger template mode results can be filtered by one or several parameters listed below.
| Parameter | Description |
|---|---|
| Template group | Filter hosts by triggers that are inherited from templates belonging to the selected template group. |
| Template | Filter hosts by triggers that are inherited from the selected template, including nested templates. If a nested template has its own triggers, those triggers will not be displayed. |
| Template trigger | Filter hosts by the selected trigger. Other triggers of the filtered hosts will not be displayed. |
| Host group | Filter hosts belonging to the selected host group. |
Filtering by host
In the By host mode results can be filtered by a host or by the host group. Specifying a parent host group implicitly selects all nested host groups.
Time period selector
The Time period selector allows to select often required periods with one mouse click. The Time period selector can be expanded and collapsed by clicking the Time period tab next to the filter.
Clicking on Show in the Graph column displays a bar graph where availability information is displayed in bar format each bar representing a past week of the current year.
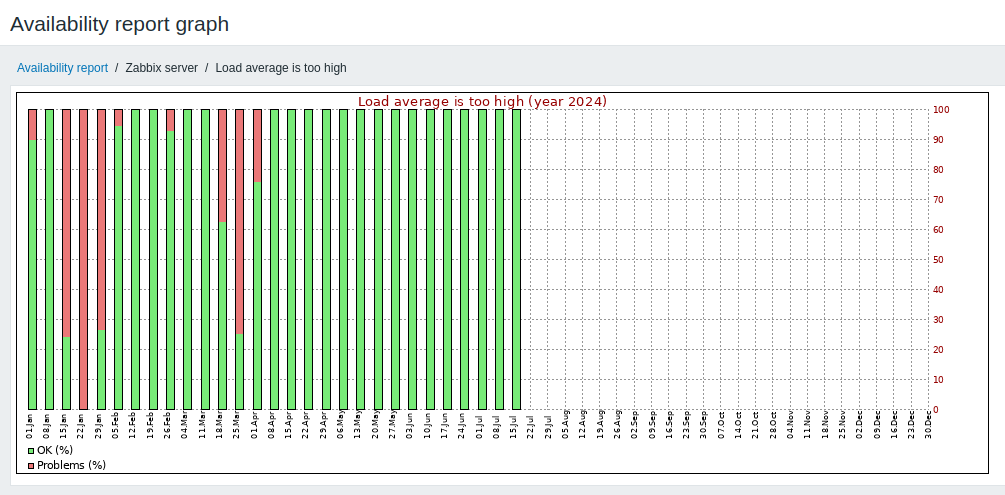
The green part of a bar stands for OK time and red for problem time.