Documentation

Table of Contents
FIXME This page is not fully translated, yet. Please help completing the translation.
(remove this paragraph once the translation is finished)
9. Monitoramento de máquinas virtuais
Visão geral
Support of monitoring VMware environments is available in Zabbix starting with version 2.2.0.
Zabbix can use low-level discovery rules to automatically discover VMware hypervisors and virtual machines and create hosts to monitor them, based on pre-defined host prototypes.
The default dataset in Zabbix offers several ready-to-use templates for monitoring VMware vCenter or ESX hypervisor.
The minum required VMware vCenter or vSphere version is 4.1.
Details
The virtual machine monitoring is done in two steps. First the data is gathered by vmware collector Zabbix processes. Those processes obtain the necessary information from VMware web services over the SOAP protocol, pre-process it and store into Zabbix server shared memory. Then the data is retrieved by pollers using Zabbix simple check VMware keys.
Data gathering from a single VMware service is always done by a single collector process and can't be shared over multiple collector processes. However, multiple collectors can process multiple VMware services simultaneously. Because of that instead of monitoring the whole vCenter service for larger installations it is recommended to monitor its ESX hypervisors directly.
Configuration
For virtual machine monitoring to work, Zabbix should be compiled with the --with-libxml2 and --with-libcurl compilation options.
The following configuration file options can be used to tune the Virtual machine monitoring:
| Option | Value | Description | |
|---|---|---|---|
| Range | Default | ||
| StartVMwareCollectors | 0-250 | 0 | Number of pre-forked vmware collector instances. |
| VMwareCacheSize | 256K-2G | 8M | Shared memory size for storing VMware data. A VMware internal check zabbix[vmware,buffer,...] can be used to monitor the VMware cache usage (see Internal checks). Note that shared memory is not allocated if there are no vmware collector instances configured to start. |
| VMwareFrequency | 10-86400 | 60 | Delay in seconds between data gathering from a single VMware service. This delay should be set to the least delay period of an VMware monitoring item. |
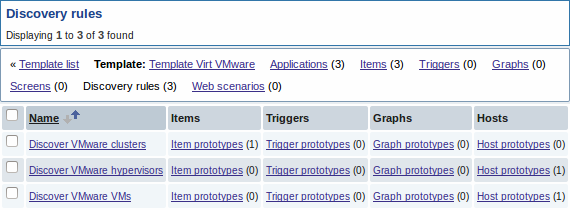
Discovery
Zabbix can use a low-level discovery rule to automatically discover VMware hypervisors and virtual machines.
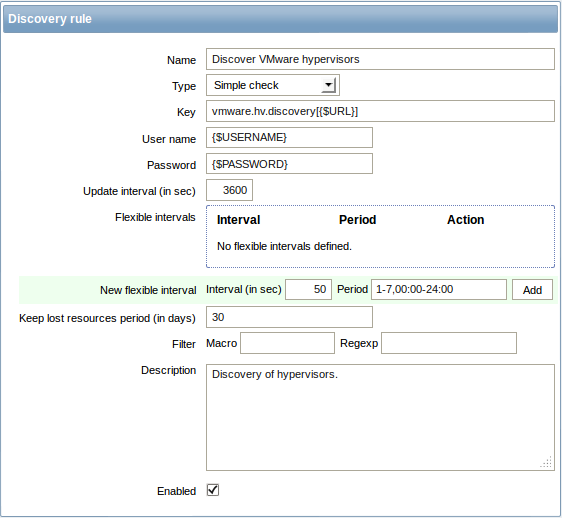
Discovery rule key in the above screenshot is vmware.hv.discovery[{$URL}].
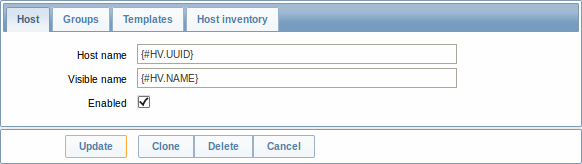
Host prototypes
Host prototypes can be created with the low-level discovery rule. When virtual machines are discovered, these prototypes become real hosts. Prototypes, before becoming discovered, cannot have their own items and triggers, other than those from the linked templates. Discovered hosts will belong to an existing host and will take the IP of the existing host for the host configuration.
In a host prototype configuration, LLD macros are used for the host name, visible name and host group prototype fields. Host status, linkage to existing host groups and template linkage are other options that can be set.
Discovered hosts are prefixed with the name of the discovery rule that created them, in the host list. Discovered hosts can be manually deleted. Discovered hosts will also be automatically deleted, based on the Keep lost resources period (in days) value of the discovery rule. Most of the configuration options are read-only, except for enabling/disabling the host and host inventory. Discovered hosts cannot have host prototypes of their own.
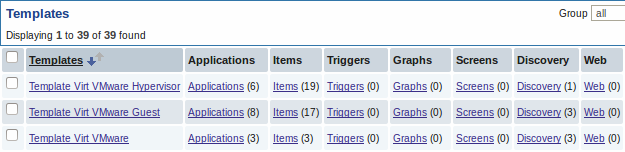
Ready-to-use templates
The default dataset in Zabbix offers several ready-to-use templates for monitoring VMware vCenter or directly ESX hypervisor.
These templates contain pre-configured LLD rules as well as a number of built-in checks for monitoring virtual installations.
Note that Template Virt VMware template should be used for VMware vCenter and ESX hypervisor monitoring. The Template Virt VMware Hypervisor and Template Virt VMware Guest templates are used by discovery and normally should not be manually linked to a host.
Host configuration
To use VMware simple checks the host must have the following user macros defined:
- {$URL} - VMware service (vCenter or ESX hypervisor) SDK URL (https://servername/sdk).
- {$USERNAME} - VMware service user name
- {$PASSWORD} - VMware service {$USERNAME} user passsword
Example
The following example demonstrates how to quickly setup VMware monitoring on Zabbix:
- compile zabbix server with required options (--with-libxml2 and --with-libcurl)
- set the StartVMwareCollectors option in Zabbix server configuration file to 1 or more
- create a new host
- set the host macros required for VMware authentication:
    {{..:..:assets:en:manual:vm_monitoring:vm_host_macros.png|}}
       * Link the host to the VMware service template:
           {{..:..:assets:en:manual:vm_monitoring:vm_host_templates.png|}}
       * Click on the //Add// button to save the host
Extended monitoring
The data gathered by VMware collector can be logged for detailed debugging using debug level 5. This level can only be set using a runtime control option (-R log_level_increase="vmware collector,N", where N is a process number). Providing debug level 4 is already set, extended monitoring can be started as demonstrated in the following examples:
Increase log level of all vmware collectors:
       shell> zabbix_server -R log_level_increase="vmware collector"

       Increase log level of second vmware collector:
       shell> zabbix_server -R log_level_increase="vmware collector,2"
If extended monitoring of VMware collector data is not required it can be stopped using the -R log_level_decrease option.