
Table of Contents
2 可用性报表
概览
在报表 - >可用性报表中,您可以查看每个触发器处于问题/正常状态的时间比例。显示每种状态的时间百分比。
因此,很容易确定系统上各种元素的可用性情况。
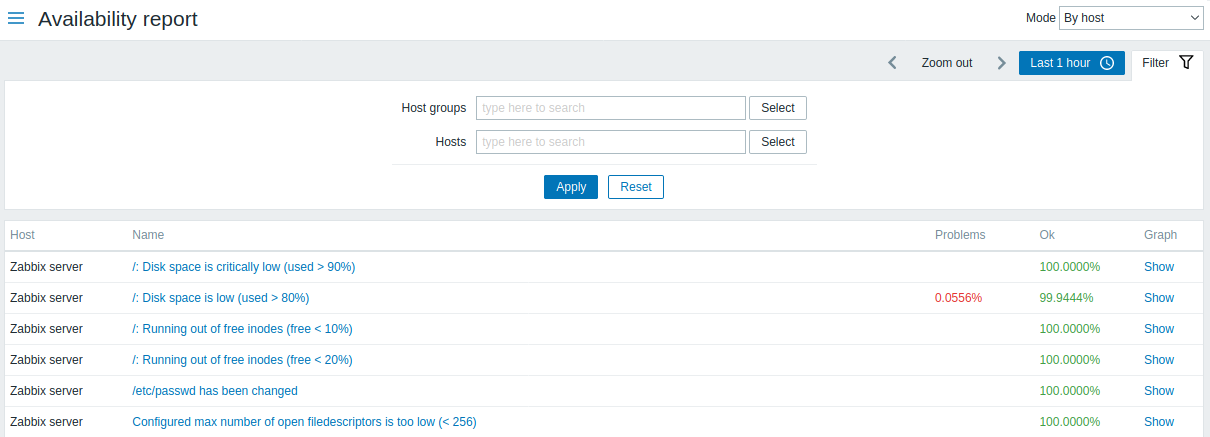
从右上角的下拉列表中,可以选择选择模式-是按主机显示触发还是按模板触发显示。
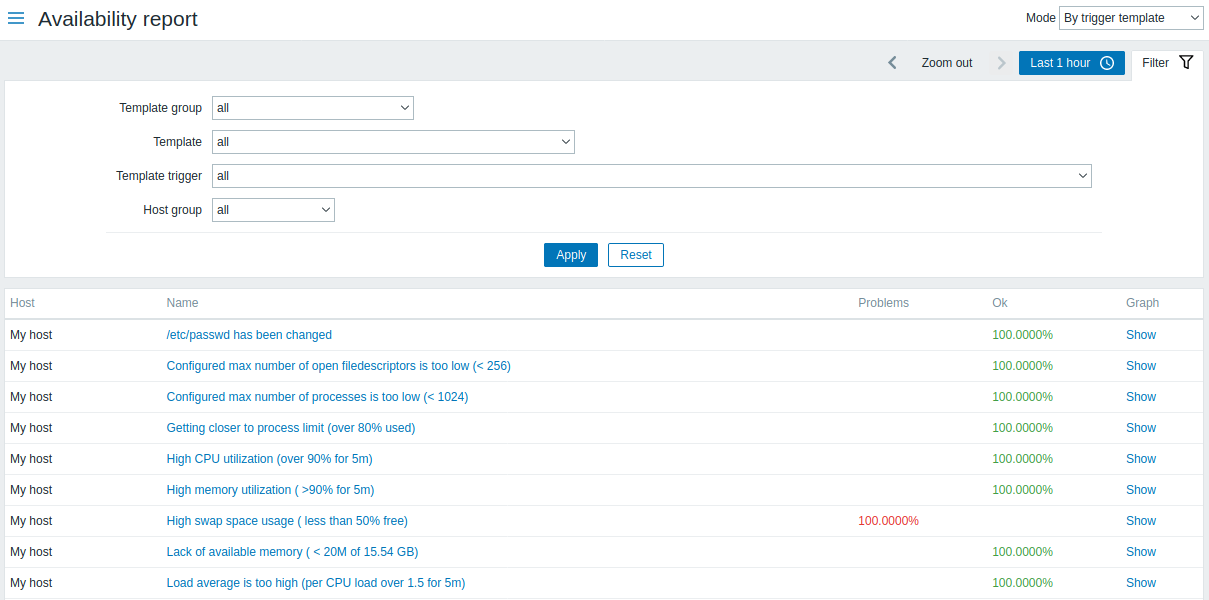
触发器的名称是指向该触发器的最新事件的链接。
使用过滤器
过滤器可以帮助缩小显示的主机和/或触发器的数量。过滤器位于可用性报表栏下方。单击左侧的“过滤器”选项卡可以将其打开和折叠。
按触发器模板过滤
在触发器模板模式下,可以通过下面列出的一个或几个参数进行过滤结果。
| 参数 描 | |
|---|---|
| 模板组 从属 | 该组的模板中选择所有带有触发器的主机。选择至少包含一个模板的任何主机组。 |
| 模板 从 | 选模板和所有嵌套模板中选择带有触发器的主机。仅显示从所选模板继承的触发器。不显示嵌套模板中具有的其他的触发器。 |
| 模板触发器 选择具有 | 定触发器的主机。不会显示所选主机的其他触发器。 |
| 主机组 选择 | 于该组的主机。 |
按主机过滤
在按主机模式下,可以按主机或主机组过滤结果。指定父主机组将隐式选择所有嵌套主机组。
时间周期选择器
时间选择器 允许通过单击鼠标选择经常需要的时间段。 单击过滤器旁边的时间段选项卡可以打开时间段选择器。
点击“图形”列中的查看显示一个条形图,其中可用性信息以条形图显示,每个条形图表示当年过去一周的数据。
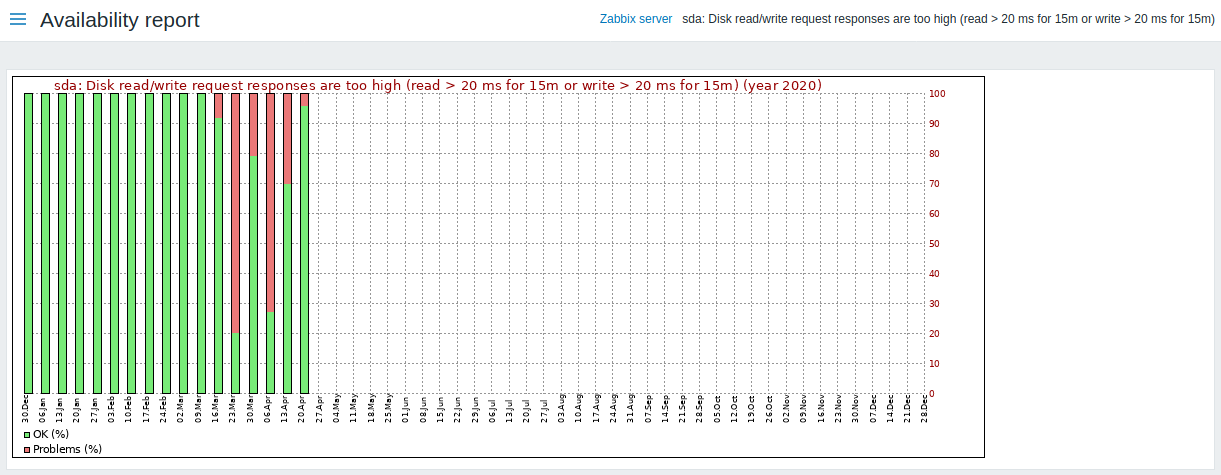
绿色部分代表OK时间,红色表示异常时间。
Using filter
Filter can help narrow down the number of hosts and/or triggers displayed. For better search performance, data is searched with macros unresolved.
The filter is located below the Availability report bar. It can be opened and collapsed by clicking on the Filter tab on the left.
Filtering by trigger template
In the by trigger template mode results can be filtered by one or several parameters listed below.
| Parameter | Description |
|---|---|
| Template group | Select all hosts with triggers from templates belonging to that group. Any host group that includes at least one template can be selected. |
| Template | Select hosts with triggers from chosen template and all nested templates. Only triggers inherited from the selected template will be displayed. If a nested template has additional own triggers, those triggers will not be displayed. |
| //Template trigger // | Select hosts with chosen trigger. Other triggers of the selected hosts will not be displayed. |
| Host group | Select hosts belonging to the group. |
Filtering by host
In the by host mode results can be filtered by host or by host group. Specifying a parent host group implicitly selects all nested host groups.
Time period selector
The time period selector allows to select often required periods with one mouse click. The time period selector can be opened by clicking on the time period tab next to the filter.
Clicking on Show in the Graph column displays a bar graph where availability information is displayed in bar format each bar representing a past week of the current year.

The green part of a bar stands for OK time and red for problem time.