4 Web
Overview
In the Monitoring → Web section current information about web scenarios is displayed.
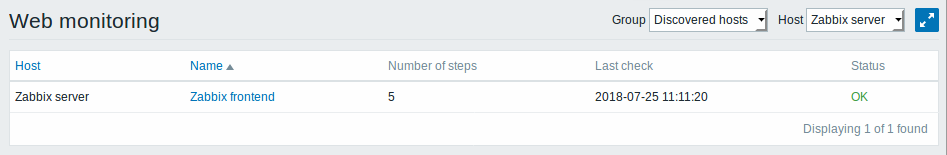
Note: The name of a disabled host is displayed in red (in both the host dropdown and the list). Data of disabled hosts is accessible starting with Zabbix 2.2.0.
Only values that fall within the last 24 hours are displayed by default. This limit has been introduced with the aim of improving initial loading times for large pages of web monitoring. It is also possible to change this limitation by changing the value of ZBX_HISTORY_PERIOD constant in include/defines.inc.php.
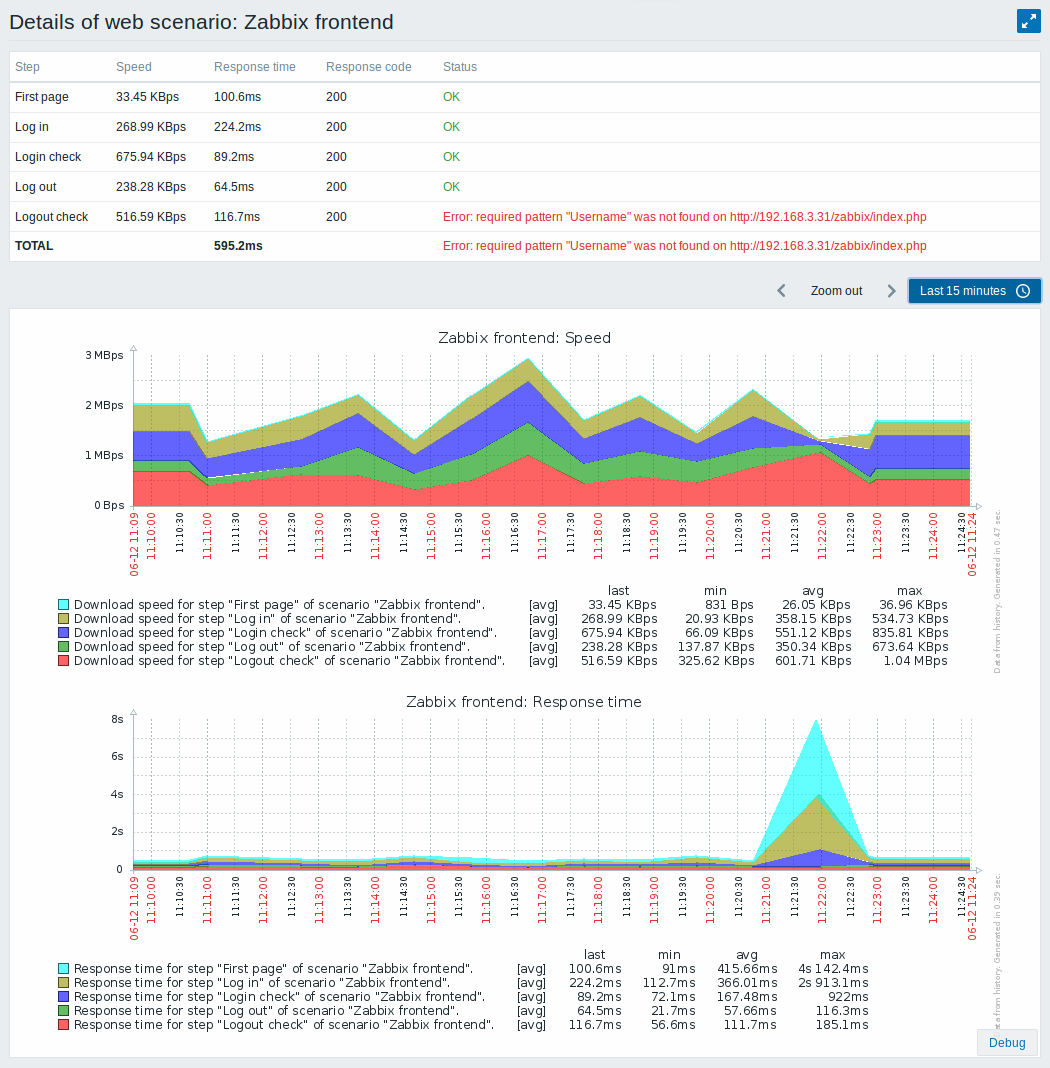
The scenario name is link to more detailed statistics about it: