2 Problems
Overview
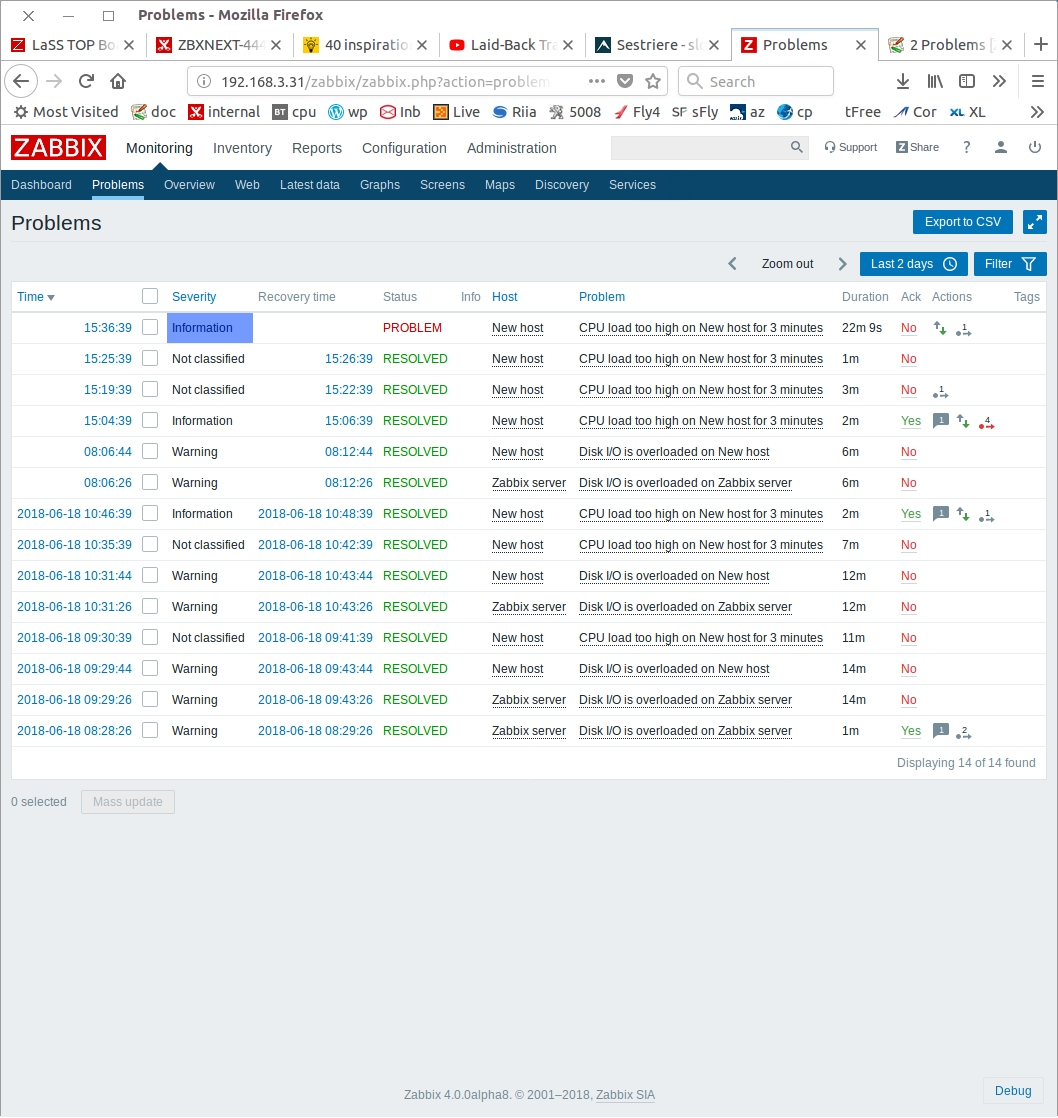
In Monitoring → Problems you can see what problems you currently have. Problems are those triggers that are in the "Problem" state.
| Column | Description |
|---|---|
| Time | Problem start time is displayed. |
| Severity | Problem severity is displayed. Problem severity is based on the severity of the underlying problem trigger. Colour of the trigger severity is used as cell background. For resolved problems, green background is used. |
| Recovery time | Problem resolution time is displayed. |
| Status | Problem status is displayed: Problem - unresolved problem Resolved - recently resolved problem. You can hide recently resolved problems using the filter. New and recently resolved problems blink for 30 minutes. Resolved problems are displayed for 30 minutes in total. Both of these values are configurable in Administration → General → Trigger displaying options. |
| Info | An green information icon is displayed if a problem is closed by global correlation or manually by acknowledgement. Rolling a mouse over the icon will display more details: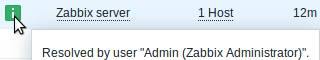 |
| Host | Problem host is displayed. |
| Problem | Problem name is displayed. Problem name is based on the name of the underlying problem trigger. |
| Duration | Problem duration is displayed. See also: negative problem duration |
| Ack | The acknowledgement status of the problem is displayed: Yes - green text indicating that the problem is acknowledged. A problem is considered to be acknowledged if all events for it are acknowledged. No - a red link indicating unacknowledged events. If you click on the link you will be taken to a bulk acknowledgement screen where all problems for this trigger can be acknowledged at once. This column is displayed if problem acknowledgement is activated in Administration → General. |
| Actions | Action status is displayed: In progress - action is being taken Done - action is completed Failures - action has failed The number of actions taken on the problem (such as notifications sent or executed remote commands) is also displayed. |
| Tags | Event tags are displayed (if any). |
Negative problem duration
It is actually possible in some common situations to have negative problem duration i.e. when the problem resolution time is earlier than problem creation time, e. g.:
- If some host is monitored by proxy and a network error happens, leading to no data received from the proxy for a while, the item.nodata() trigger will be fired by the server. When the connection is restored, the server will receive item data from the proxy having a time from the past. Then, the item.nodata() problem will be resolved and it will have a negative problem duration;
- When item data that resolve the problem event are sent by Zabbix sender and contain a timestamp earlier than the problem creation time, a negative problem duration will also be displayed.
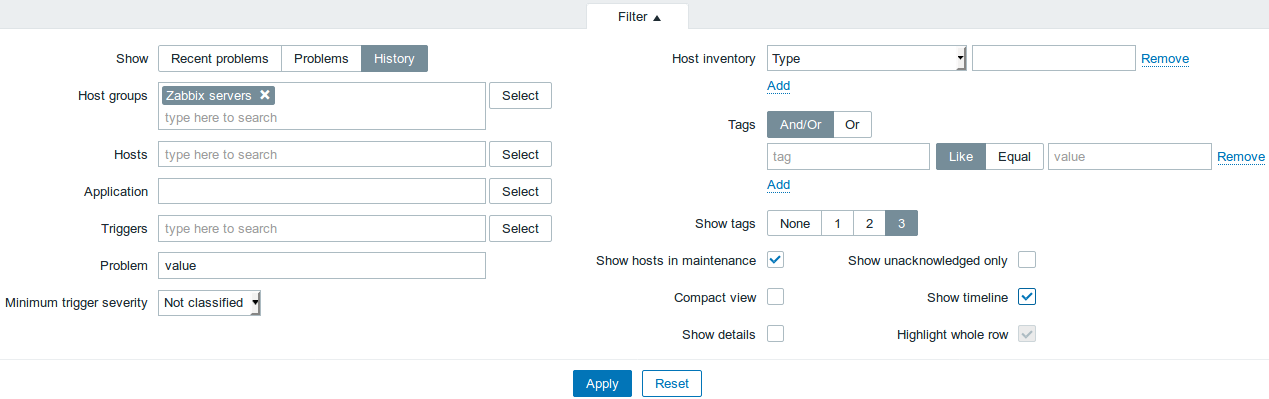
Using filter
You can use the filter to display only the problems you are interested in. The filter is located above the table.
| Parameter | Description |
|---|---|
| Show | Filter by problem status: Recent problems - unresolved and recently resolved problems are displayed (default) Problems - unresolved problems are displayed History - history of all events is displayed |
| Host group | Filter by one or more host groups. Specifying a parent host group implicitly selects all nested host groups. |
| Host | Filter by one or more hosts. |
| Application | Filter by application name. |
| Trigger | Filter by one or more triggers. |
| Problem | Filter by problem name. |
| Minimum trigger severity | Filter by minimum trigger severity. |
| Age less than | Filter by how old the problem is. |
| Host inventory | Filter by inventory type and value. |
| Tags | Filter by event tag name and value. Several conditions can be set. There are two calculation types for conditions: And/Or - all conditions must be met, conditions having same tag name will be grouped by Or condition Or - enough if one condition is met There are two ways of matching the tag value: Like - similar string match Equal - exact case-sensitive string match |
| Show tags | Select the number of displayed tags: None- no Tags column in Monitoring → Problems 1- Tags column contains one tag 2- Tags column contains two tags 3- Tags column contains three tags To see all tags for the problem roll your mouse over the three dots icon. |
| Show hosts in maintenance | Mark the checkbox to display problems of hosts in maintenance too. |
| Compact view | Mark the checkbox to enable compact view. |
| Show details | Mark the checkbox to display underlying trigger expressions of the problems. Disabled if Compact view checkbox is marked. |
| Show unacknowledged only | Mark the checkbox to display unacknowledged problems only. |
| Show timeline | Timeline row and grouping is visible when the checkbox is marked. Disabled if Compact view checkbox is marked. |
| Highlight whole row | Full line highlighting for unresolved problems is enabled when the checkbox is marked. Enabled only if Compact view checkbox is marked. |
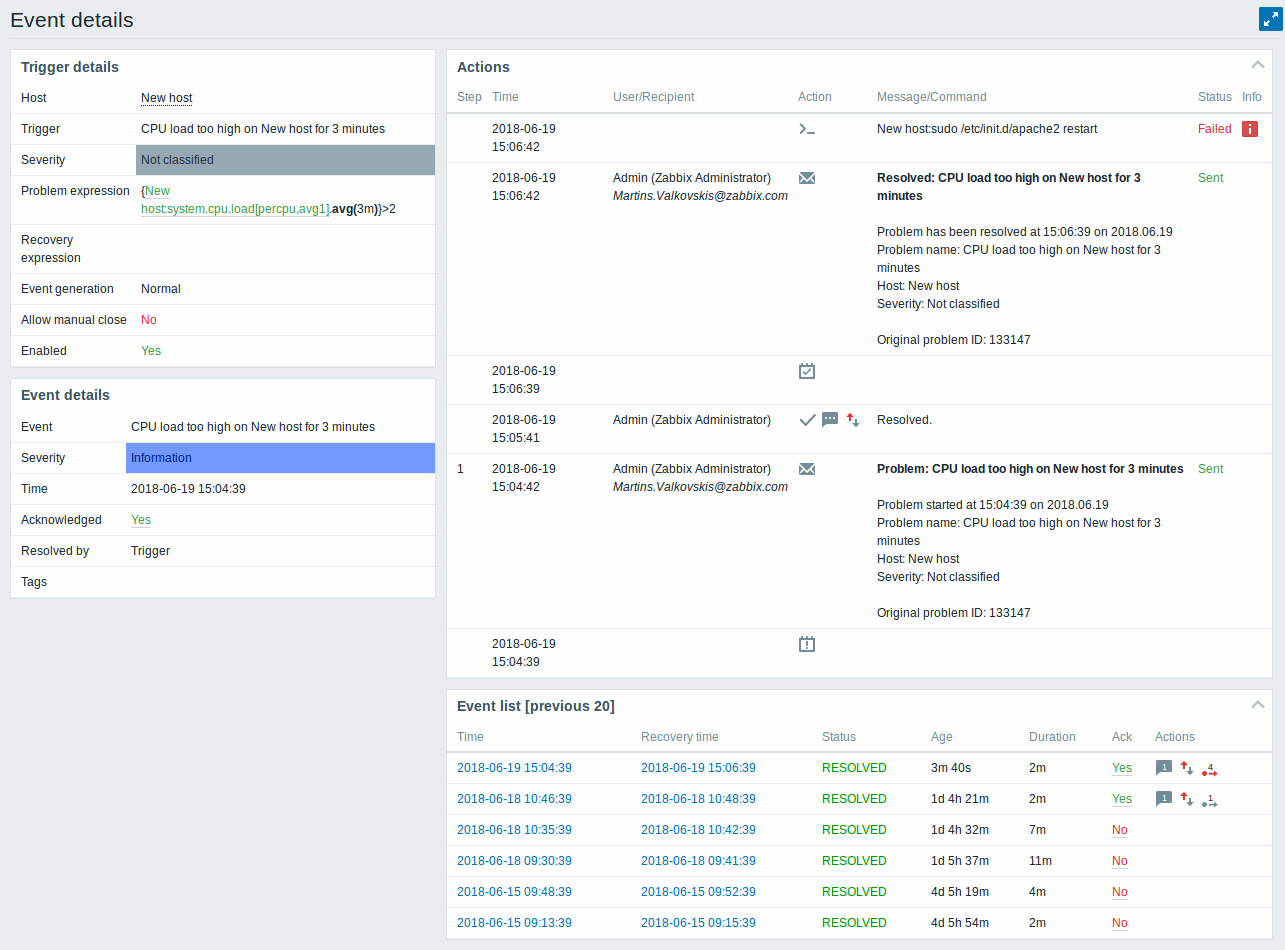
Viewing details
The times for problem start and recovery in Monitoring → Problems are links. Clicking on them opens more details of the event.