Ad Widget

Collapse

Complete HP server hardware monitoring ZBX2

Collapse
X
 
  • Time
  • Show
Clear All
new posts
  • angel_of_devil
    Junior Member
    • Sep 2011
    • 29

    #46
    Dear All,

    I have a question. Almost our HP Server have at least one System Board have very high temperature, about 7x - 8x degree C. I check through iLO and it said that "caution at 110 degree C, critical at 115 degree C". So the temperature 7x - 8x is safe temperature. Can anyone tell me why do these system board have so high temperature like that?
    Comment

    • trannghia
      Junior Member
      • Jun 2013
      • 5

      #47
      Hi all.
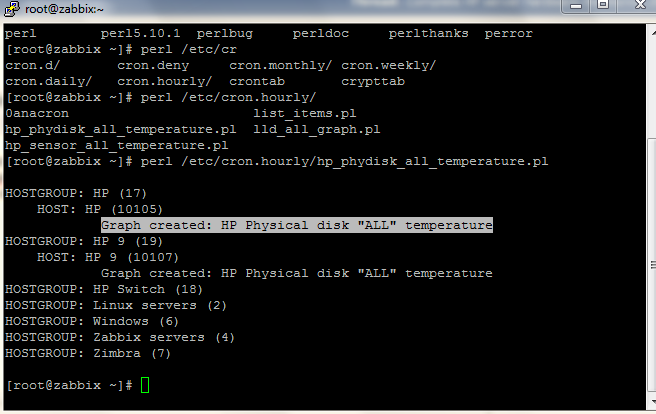
      After I'm installing and import template successful, I run command perl /etc/cron.hourly/hp_phydisk_all_temperature.pl have notices Graph created: HP Physical disk "ALL" temperature.


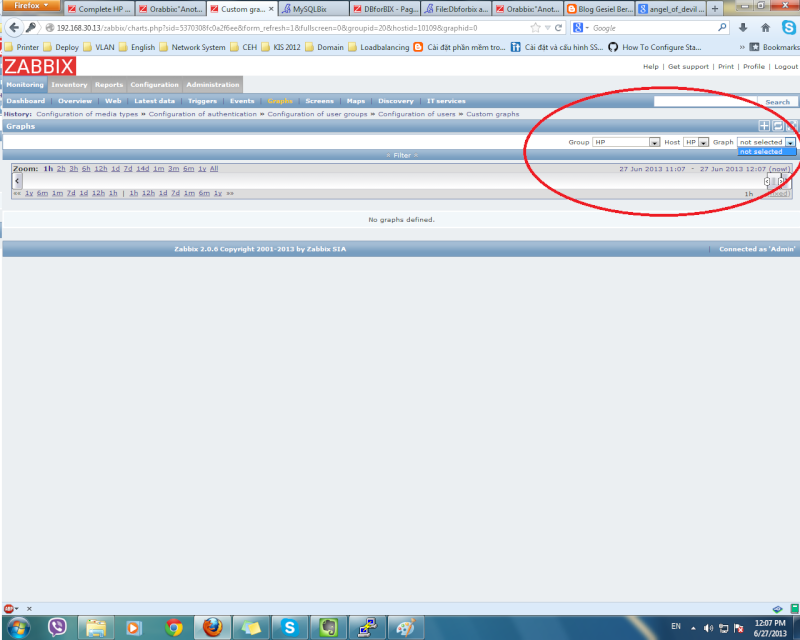
      Now i'm going to zabbix admin Configuration|Hosts| and chose template HP server in Graphs | create graphs|add Items I can not see HP Physical disk "ALL" temperature

      What is wrong ?Please tell me how to solve this, Thanks a lot.

      Comment

      • angel_of_devil
        Junior Member
        • Sep 2011
        • 29

        #48
        There's no need to create graphs. The graphs would be created automatically from Discovery. You can find the HP Physical disk "ALL" temperature graph in "Graphs" of each HP Server host.

        Comment

        • trannghia
          Junior Member
          • Jun 2013
          • 5

          #49
          Dear angel_of_devil,
          First time thank you for answer, I have someone question.
          1. I was review again all question and answer in thread, I noted answer of mmarkwitzz
          PHP Code:
          You should run script zabbix_hp_discovery.vbs PHYDISKS 

          attached is picture after i run command above. Display is correct or wrong ?
          2. I've just found HP Physical disk "ALL" temperature in Discovery rules, Now i want show it in Dashboard -> Hostgroup. How to do ?
          My Server is: HP proliant ML 330G6
          Sorry, I'm newbie in use zabbix
          Last edited by trannghia; 26-06-2013, 17:09.

          Comment

          • angel_of_devil
            Junior Member
            • Sep 2011
            • 29

            #50
            - Display is correct
            - You must create a host group with the HP server host you want to show in dashboard

            Comment

            • trannghia
              Junior Member
              • Jun 2013
              • 5

              #51
              I created and linked host to HP server template, I'm going to dashboard monitoring and chose Graphs but no choice.

              What is problem ?
              P/S:angel_of_devil, Can you help me via Skype or yahoo ID ?my skype and yahoo: thangbomit86

              Comment

              • angel_of_devil
                Junior Member
                • Sep 2011
                • 29

                #52
                Make sure your host have correct zabbix_agentd.conf configuration with active checks. You can try to link your HP host with other template ("Template OS Windows" for example, and then check Graphs menu again). Please show the log of:
                - zabbix_server.log (on zabbix server)
                - cron log (on zabbix server)
                - zabbix_agentd.log (on HP host)
                I think you have problems with your host or crontab

                Comment

                • trannghia
                  Junior Member
                  • Jun 2013
                  • 5

                  #53
                  Dear angel_of_devil
                  Attached are logs of Zabbix_server, cron, zabbix_agent(on HP host).I'm uploaded logs in to mediafire server, Pls download and help me check.

                  PHP Code:
                  You can try to link your HP host with other template ("Template OS Windows" for example, and then check Graphs menu again
                  I linked to Windows OS templates and it is running normal.


                  Thanks you.

                  Comment

                  • angel_of_devil
                    Junior Member
                    • Sep 2011
                    • 29

                    #54
                    Make sure you have correct configuration of zabbix_agentd.conf of HP-HOST. Below is a HP-HOST's agent configuration of mine:
                    # This is a config file for Zabbix Agent (Windows)
                    # To get more information about Zabbix, go to http://www.zabbix.com

                    ############ GENERAL PARAMETERS #################

                    ### Option: LogFile
                    # Name of log file.
                    # If not set, Windows Event Log is used.
                    #
                    # Mandatory: no
                    # Default:
                    # LogFile=

                    LogFile=C:\Program Files\Zabbix Agent\Zabbix_agentd.log

                    ### Option: LogFileSize
                    # Maximum size of log file in MB.
                    # 0 - disable automatic log rotation.
                    #
                    # Mandatory: no
                    # Range: 0-1024
                    # Default:
                    LogFileSize=10

                    ### Option: DebugLevel
                    # Specifies debug level
                    # 0 - no debug
                    # 1 - critical information
                    # 2 - error information
                    # 3 - warnings
                    # 4 - for debugging (produces lots of information)
                    #
                    # Mandatory: no
                    # Range: 0-4
                    # Default:
                    # DebugLevel=3
                    DebugLevel=0

                    ### Option: SourceIP
                    # Source IP address for outgoing connections.
                    #
                    # Mandatory: no
                    # Default:
                    # SourceIP=

                    ### Option: EnableRemoteCommands
                    # Whether remote commands from Zabbix server are allowed.
                    # 0 - not allowed
                    # 1 - allowed
                    #
                    # Mandatory: no
                    # Default:
                    EnableRemoteCommands=1

                    ### Option: LogRemoteCommands
                    # Enable logging of executed shell commands as warnings.
                    # 0 - disabled
                    # 1 - enabled
                    #
                    # Mandatory: no
                    # Default:
                    # LogRemoteCommands=0

                    ##### Passive checks related

                    ### Option: Server
                    # List of comma delimited IP addresses (or hostnames) of Zabbix servers.
                    # Incoming connections will be accepted only from the hosts listed here.
                    # No spaces allowed.
                    # If IPv6 support is enabled then '127.0.0.1', '::127.0.0.1', '::ffff:127.0.0.1' are treated equally.
                    #
                    # Mandatory: no
                    # Default:
                    # Server=

                    Server=10.10.20.85

                    ### Option: ListenPort
                    # Agent will listen on this port for connections from the server.
                    #
                    # Mandatory: no
                    # Range: 1024-32767
                    # Default:
                    ListenPort=10050

                    ### Option: ListenIP
                    # List of comma delimited IP addresses that the agent should listen on.
                    # First IP address is sent to Zabbix server if connecting to it to retrieve list of active checks.
                    #
                    # Mandatory: no
                    # Default:
                    # ListenIP=0.0.0.0

                    ### Option: StartAgents
                    # Number of pre-forked instances of zabbix_agentd that process passive checks.
                    # If set to 0, disables passive checks and the agent will not listen on any TCP port.
                    #
                    # Mandatory: no
                    # Range: 0-100
                    # Default:
                    StartAgents=1

                    ##### Active checks related

                    ### Option: ServerActive
                    # List of comma delimited IPort (or hostnameort) pairs of Zabbix servers for active checks.
                    # If port is not specified, default port is used.
                    # IPv6 addresses must be enclosed in square brackets if port for that host is specified.
                    # If port is not specified, square brackets for IPv6 addresses are optional.
                    # If this parameter is not specified, active checks are disabled.
                    # Example: ServerActive=127.0.0.1:20051,zabbix.domain,[::1]:30051,::1,[12fc::1]
                    #
                    # Mandatory: no
                    # Default:
                    # ServerActive=

                    ServerActive=10.10.20.85:10051

                    ### Option: Hostname
                    # Unique, case sensitive hostname.
                    # Required for active checks and must match hostname as configured on the server.
                    # Value is acquired from HostnameItem if undefined.
                    #
                    # Mandatory: no
                    # Default:
                    Hostname=HP-HOST01

                    ### Option: HostnameItem
                    # Item used for generating Hostname if it is undefined.
                    # Ignored if Hostname is defined.
                    #
                    # Mandatory: no
                    # Default:
                    # HostnameItem=system.hostname

                    ### Option: RefreshActiveChecks
                    # How often list of active checks is refreshed, in seconds.
                    #
                    # Mandatory: no
                    # Range: 60-3600
                    # Default:
                    # RefreshActiveChecks=120

                    ### Option: BufferSend
                    # Do not keep data longer than N seconds in buffer.
                    #
                    # Mandatory: no
                    # Range: 1-3600
                    # Default:
                    # BufferSend=5

                    ### Option: BufferSize
                    # Maximum number of values in a memory buffer. The agent will send
                    # all collected data to Zabbix server or Proxy if the buffer is full.
                    #
                    # Mandatory: no
                    # Range: 2-65535
                    # Default:
                    # BufferSize=100

                    ### Option: MaxLinesPerSecond
                    # Maximum number of new lines the agent will send per second to Zabbix Server
                    # or Proxy processing 'log', 'logrt' and 'eventlog' active checks.
                    # The provided value will be overridden by the parameter 'maxlines',
                    # provided in 'log', 'logrt' or 'eventlog' item keys.
                    #
                    # Mandatory: no
                    # Range: 1-1000
                    # Default:
                    # MaxLinesPerSecond=100

                    ############ ADVANCED PARAMETERS #################

                    ### Option: Alias
                    # Sets an alias for parameter. It can be useful to substitute long and complex parameter name with a smaller and simpler one.
                    # For example, if you wish to retrieve paging file usage in percents from the server,
                    # you may use parameter "perf_counter[\Paging File(_Total)\% Usage]", or you may define an alias by adding the following line to configuration file
                    # Alias = pg_usageerf_counter[\Paging File(_Total)\% Usage]
                    # After that you can use parameter name "pg_usage" to retrieve the same information.
                    # You can specify as many "Alias" records as you wish.
                    # Aliases cannot be used for parameters defined in "PerfCounter" configuration file records.
                    #
                    # Mandatory: no
                    # Range:
                    # Default:

                    ### Option: Timeout
                    # Spend no more than Timeout seconds on processing
                    #
                    # Mandatory: no
                    # Range: 1-30
                    # Default:
                    Timeout=30

                    ### Option: PerfCounter
                    # Syntax: <parameter_name>,"<perf_counter_path>",<period>
                    # Defines new parameter <parameter_name> which is an average value for system performance counter <perf_counter_path> for the specified time period <period> (in seconds).
                    # For example, if you wish to receive average number of processor interrupts per second for last minute, you can define new parameter "interrupts" as following:
                    # PerfCounter = interrupts,"\Processor(0)\Interrupts/sec",60
                    # Please note double quotes around performance counter path.
                    # Samples for calculating average value will be taken every second.
                    # You may run "typeperf -qx" to get list of all performance counters available in Windows.
                    #
                    # Mandatory: no
                    # Range:
                    # Default:

                    ### Option: Include
                    # You may include individual files in the configuration file.
                    #
                    # Mandatory: no
                    # Default:
                    # Include=

                    # Include=c:\zabbix\zabbix_agentd.userparams.conf
                    # Include=c:\zabbix\zabbix_agentd\

                    ####### USER-DEFINED MONITORED PARAMETERS #######

                    ### Option: UnsafeUserParameters
                    # Allow all characters to be passed in arguments to user-defined parameters.
                    # 0 - do not allow
                    # 1 - allow
                    #
                    # Mandatory: no
                    # Range: 0-1
                    # Default:
                    # UnsafeUserParameters=0

                    ### Option: UserParameter
                    # User-defined parameter to monitor. There can be several user-defined parameters.
                    # Format: UserParameter=<key>,<shell command>
                    # Note that shell command must not return empty string or EOL only.
                    # Example: UserParameter=system.test,echo 1
                    #UserParameter=system.test,echo 1

                    #hp discovery
                    UserParameter = hp.discovery[*],cscript "C:\Program Files\Zabbix Agent\zabbix_hp_discovery.vbs" //Nologo "$1"
                    #hp wbem
                    UserParameter = hp.wbem[*],cscript "C:\Program Files\Zabbix Agent\zabbix_hp_wbem.vbs" //Nologo "$1" "$2" "$3"
                    #hp system
                    UserParameter = hp.system[*],cscript "C:\Program Files\Zabbix Agent\zabbix_hp_system.vbs" //Nologo "$1"
                    #eventlog query
                    UserParameter = eventlog.query[*],cscript "C:\Program Files\Zabbix Agent\zabbix_win_eventlog.vbs" //Nologo "$1" "$2"
                    # allow weird chars in userparameters arguments
                    UnsafeUserParameters=1
                    10.10.20.85 is IP address of my Zabbix server. Make sure all of "Items" and "Discovery rules" in HP Server template having Enable status and no errors (with green color).

                    You can try delete HP Server template and import it again (must be without any error). After having linked HP Server template to host, please wait about 1 minute and then check the "Latest data" of HP host from Monitoring menu. Hope that you can see a lot of HP items.

                    Comment

                    • trannghia
                      Junior Member
                      • Jun 2013
                      • 5

                      #55
                      Now, it is done, I config incorrect in host-name, Thank you very much angel_of_devil

                      Comment

                      • angel_of_devil
                        Junior Member
                        • Sep 2011
                        • 29

                        #56
                        Dear mmarkwitzz,

                        I have screen with some graph of HP Servers. Now I'm having problem with disappear of HP Sensor "ALL" Temperature graph. It only appears for a while and then disappear. I dont know why. Can you help me to solve this problem? And another problem is HP Physical disk "ALL" temperature. It cannot get data anymore, always no data

                        OS: Centos 6.4 x64
                        Zabbix: 2.0.2
                        Last edited by angel_of_devil; 21-08-2013, 12:19.

                        Comment

                        • ViolatorDM
                          Junior Member
                          • Nov 2013
                          • 5

                          #57
                          Error in script

                          Hello.

                          Starting script: "zabbix_hp_discovery.vbs PHYDISKS"

                          Reporting error: "zabbix_hp_discovery.vbs(494, 2) SWbemObjectSet: Invalid class"

                          How can i fix it?

                          Comment

                          • jpera
                            Junior Member
                            • Dec 2013
                            • 4

                            #58
                            Attachment link not working

                            Hi, I have tried to download the script but when I click on the attachment link I just get the download for a file called "attachment.php" and cannot get the zip file. Could you please post it again so i can download it?

                            Thank you.

                            J.

                            Comment

                            • fedotov_m
                              Junior Member
                              • May 2014
                              • 1

                              #59
                              Wbem

                              Hi. I can't find a way to download WBEM from HP site. Can you help me? I need a WBEM for my DL320e. I spent a lot of time and I really can't find a link!

                              Comment

                              • jpera
                                Junior Member
                                • Dec 2013
                                • 4

                                #60
                                WBEM providers

                                Hi,
                                you can find them in the following link:


                                You should look in www.hp.com, the go to support, search for drivers, search for DL320e, then choose Windows 2008 (I supposed you need that) and then they are under System Management. I don't know why they don't appear under Windows 2012. I have not checked for Linux dsitributions....

                                Hope this helps.

                                Jordi

                                Comment

                                Working...