
Hi all,
VmBix is a multi-threaded TCP proxy for the VMWare Sphere API written in Java. It accepts connections from a Zabbix server/proxy/agent or the zabbix_get binary and translates them to VMWare API calls.
Starting from version 2.2, Zabbix can natively monitor a VMWare environment. But there are a few drawbacks :
- The monitored items are not all very relevant
- This is not easily extensible
- The created ESX and VM hosts are mostly read-only. You cannot attach them different templates, put them into different groups, or use a Zabbix agent to monitor their OS or apps
VmBix helps you to overcome these limitations, with very good performance. It is multi-threaded, implements objects caching, and can be queried using a Zabbix loadable module.
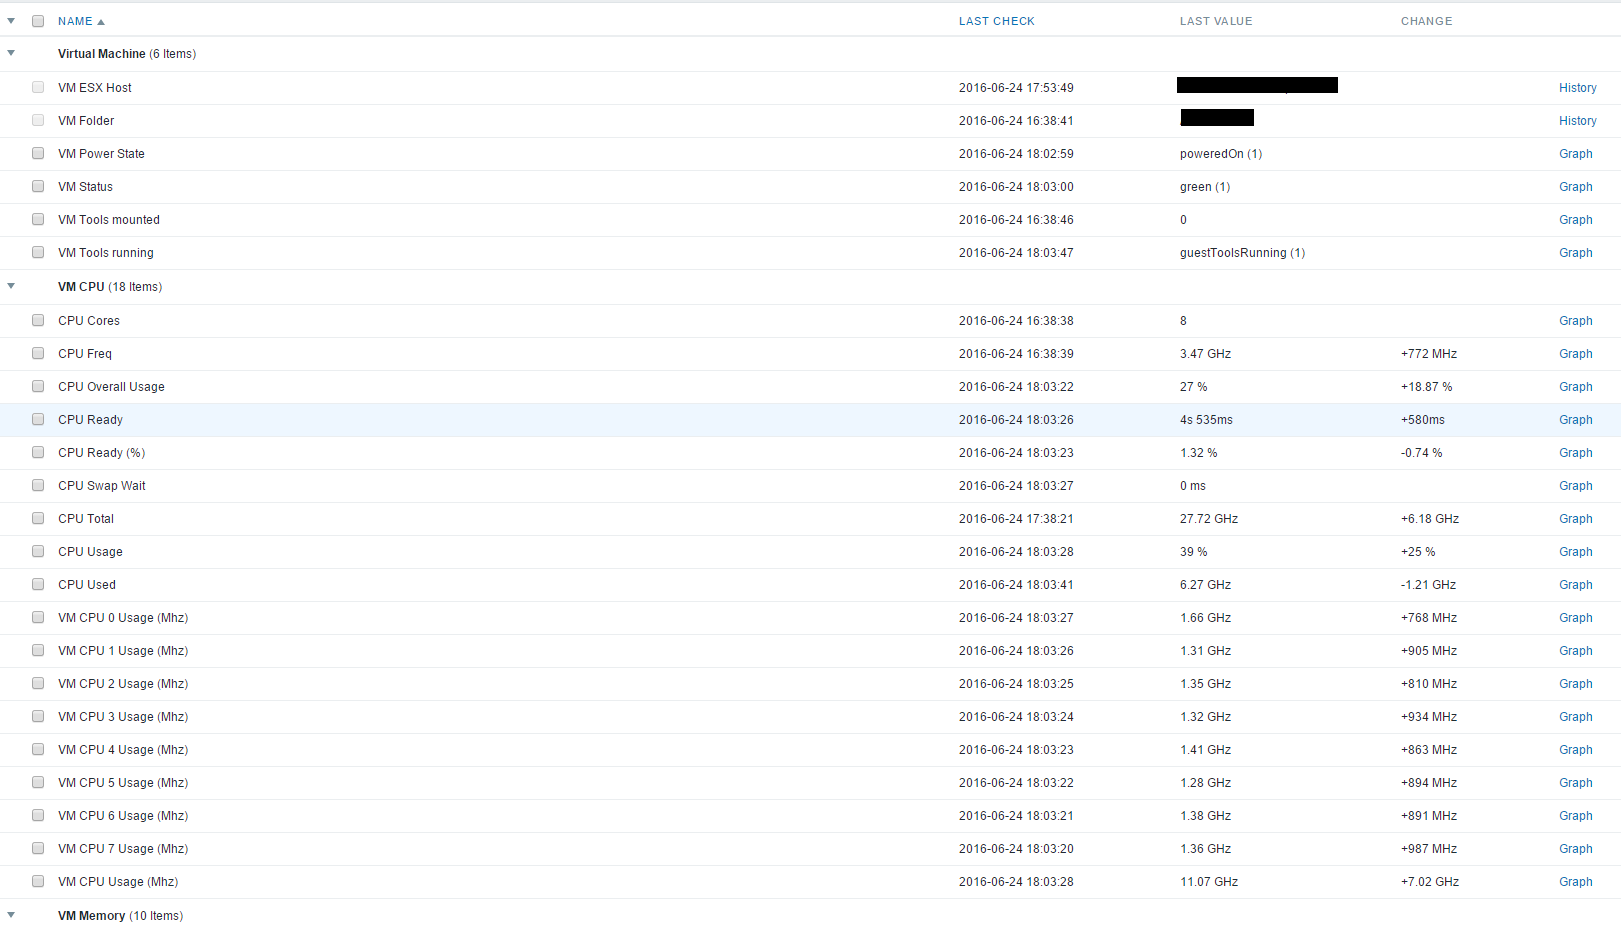
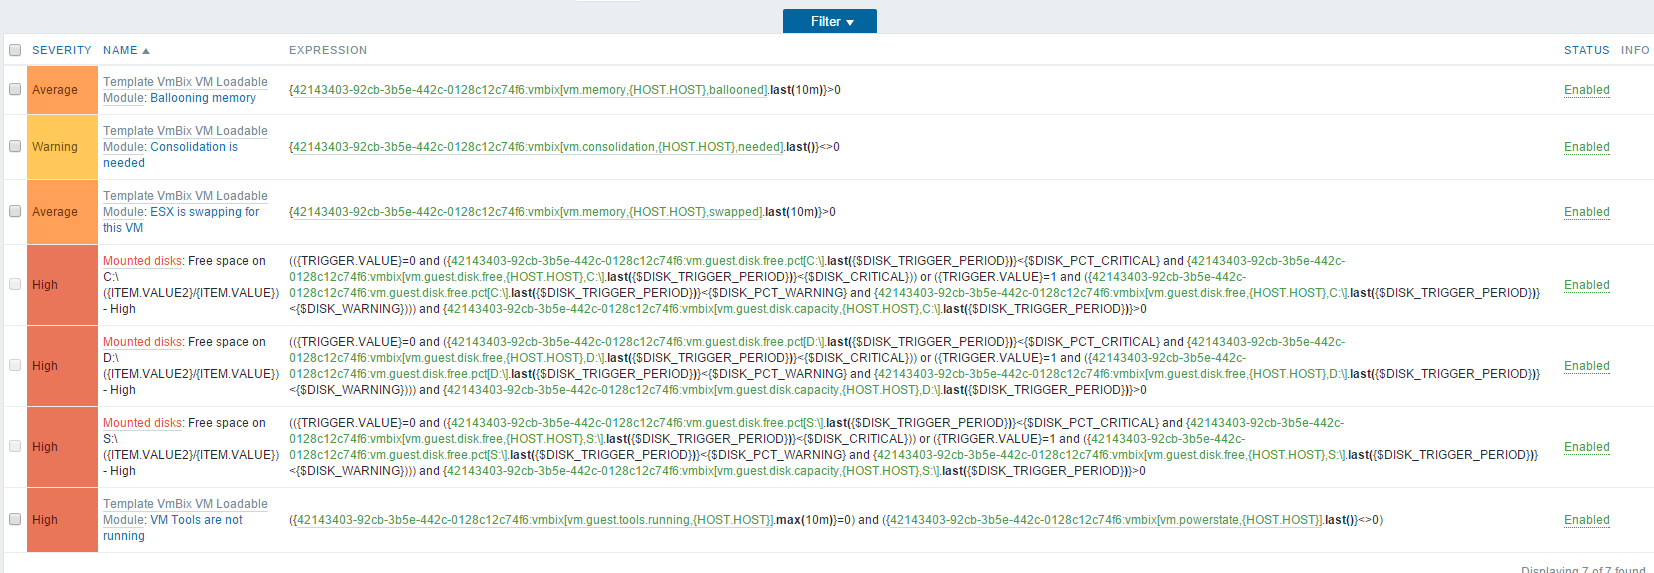
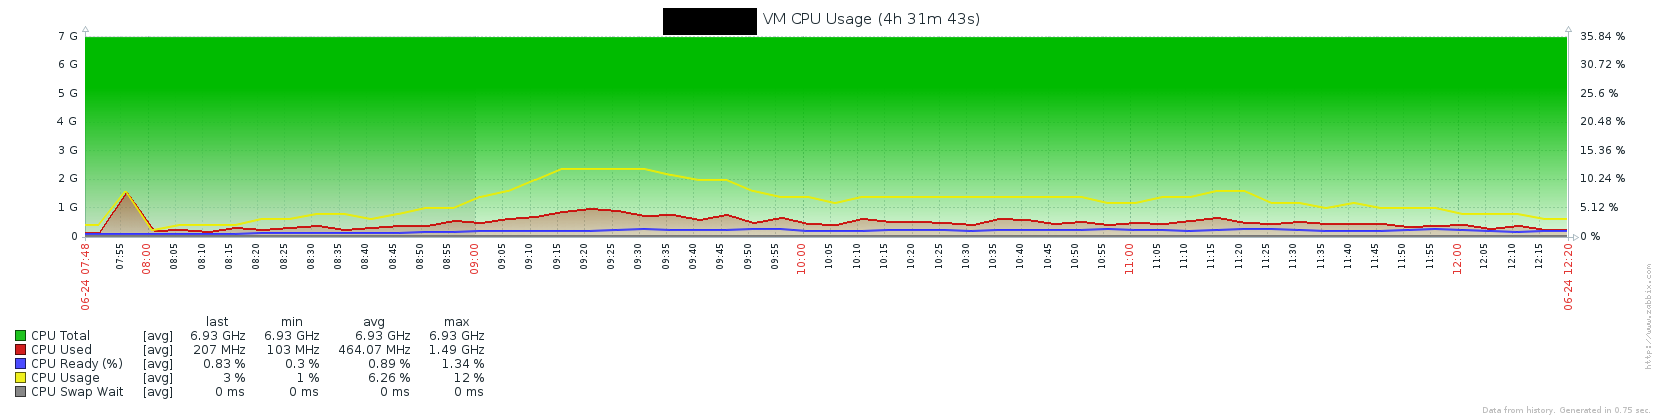
VmBix comes with a set of templates adding several monitored items, triggers and graphs in Zabbix. A sample import script is also provided. It automatically creates regular Zabbix hosts for hypervisors, VMs & datastores, allowing them to be monitored with a Zabbix agent in parallel, or the use different templates/groups for different hosts. Here are a few screenshots of what you can expect in Zabbix :
You can use VmBix methods to query interesting VMWare metrics, for example :
The version 2.5 was released. Here is the CHANGELOG :
- ***BREAKING CHANGE*** : all parameters in the configuration file vmbix.conf and on the command line must now be in lowercase. The possible arguments in command line have also changed. See the "usage" output.
- Improved the script vmbix-object-sync
- Hacked the vm.guest.disk.* methods with a workaround for ZBX-10590. If a disk name ends with \, a space will be added at the end of the disk name. This is controlled by the parameter escapechars in the configuration file. It is set to false by default.
- Fixed the ESX usage item in the template.
- Code cleanup and better error handling
- Added the vm.stats methods :
vm.stats[threads] indicates the number of working threads
vm.stats[queue] indicates the size of the connection queue
vm.stats[requests] indicates the number of requests received by VmBix
vmbix.stats[cachesize,(vm|esxi|ds|perf|counter|hri|cluster)] indicates the size of each cache
vmbix.stats[hitrate,(vm|esxi|ds|perf|counter|hri|cluster)] indicates the hit rate of each cache (1.0 = 100% hits)
- Exposed the following parameters in the configuration
connecttimeout : the VmWare API connect timeout
readtimeout : the VmWare API read timeout
maxconnections : the maximum number of concurrent connections accepted by Vmbix
Here are the download links for the VmBix packages and its Zabbix loadable module.
There is now a Wiki reference page with all the supported methods.
All the details here :
VmBix is a multi-threaded TCP proxy for the VMWare Sphere API written in Java. It accepts connections from a Zabbix server/proxy/agent or the zabbix_get binary and translates them to VMWare API calls.
Starting from version 2.2, Zabbix can natively monitor a VMWare environment. But there are a few drawbacks :
- The monitored items are not all very relevant
- This is not easily extensible
- The created ESX and VM hosts are mostly read-only. You cannot attach them different templates, put them into different groups, or use a Zabbix agent to monitor their OS or apps
VmBix helps you to overcome these limitations, with very good performance. It is multi-threaded, implements objects caching, and can be queried using a Zabbix loadable module.
VmBix comes with a set of templates adding several monitored items, triggers and graphs in Zabbix. A sample import script is also provided. It automatically creates regular Zabbix hosts for hypervisors, VMs & datastores, allowing them to be monitored with a Zabbix agent in parallel, or the use different templates/groups for different hosts. Here are a few screenshots of what you can expect in Zabbix :
You can use VmBix methods to query interesting VMWare metrics, for example :
Code:
esx.counter[esx01.domain.local,cpu.ready.summation]
1135
Code:
vm.counter.discovery[VM01,virtualDisk.totalReadLatency.average]
{
    "data": [
        {
            "{#METRICINSTANCE}": "scsi2:2"
        },
        {
            "{#METRICINSTANCE}": "scsi2:1"
        },
        {
            "{#METRICINSTANCE}": "scsi2:0"
        },
        {
            "{#METRICINSTANCE}": "scsi2:6"
        },
        {
            "{#METRICINSTANCE}": "scsi2:5"
        },
        {
            "{#METRICINSTANCE}": "scsi2:4"
        },
        {
            "{#METRICINSTANCE}": "scsi2:3"
        }
    ]
}
Code:
vm.counter[VM01,virtualDisk.totalReadLatency.average,scsi2:4,300]
2
- ***BREAKING CHANGE*** : all parameters in the configuration file vmbix.conf and on the command line must now be in lowercase. The possible arguments in command line have also changed. See the "usage" output.
- Improved the script vmbix-object-sync
- Hacked the vm.guest.disk.* methods with a workaround for ZBX-10590. If a disk name ends with \, a space will be added at the end of the disk name. This is controlled by the parameter escapechars in the configuration file. It is set to false by default.
- Fixed the ESX usage item in the template.
- Code cleanup and better error handling
- Added the vm.stats methods :
vm.stats[threads] indicates the number of working threads
vm.stats[queue] indicates the size of the connection queue
vm.stats[requests] indicates the number of requests received by VmBix
vmbix.stats[cachesize,(vm|esxi|ds|perf|counter|hri|cluster)] indicates the size of each cache
vmbix.stats[hitrate,(vm|esxi|ds|perf|counter|hri|cluster)] indicates the hit rate of each cache (1.0 = 100% hits)
- Exposed the following parameters in the configuration
connecttimeout : the VmWare API connect timeout
readtimeout : the VmWare API read timeout
maxconnections : the maximum number of concurrent connections accepted by Vmbix
Here are the download links for the VmBix packages and its Zabbix loadable module.
There is now a Wiki reference page with all the supported methods.
All the details here :


Comment