
I made the dashboard using the API of Zabbix
Features
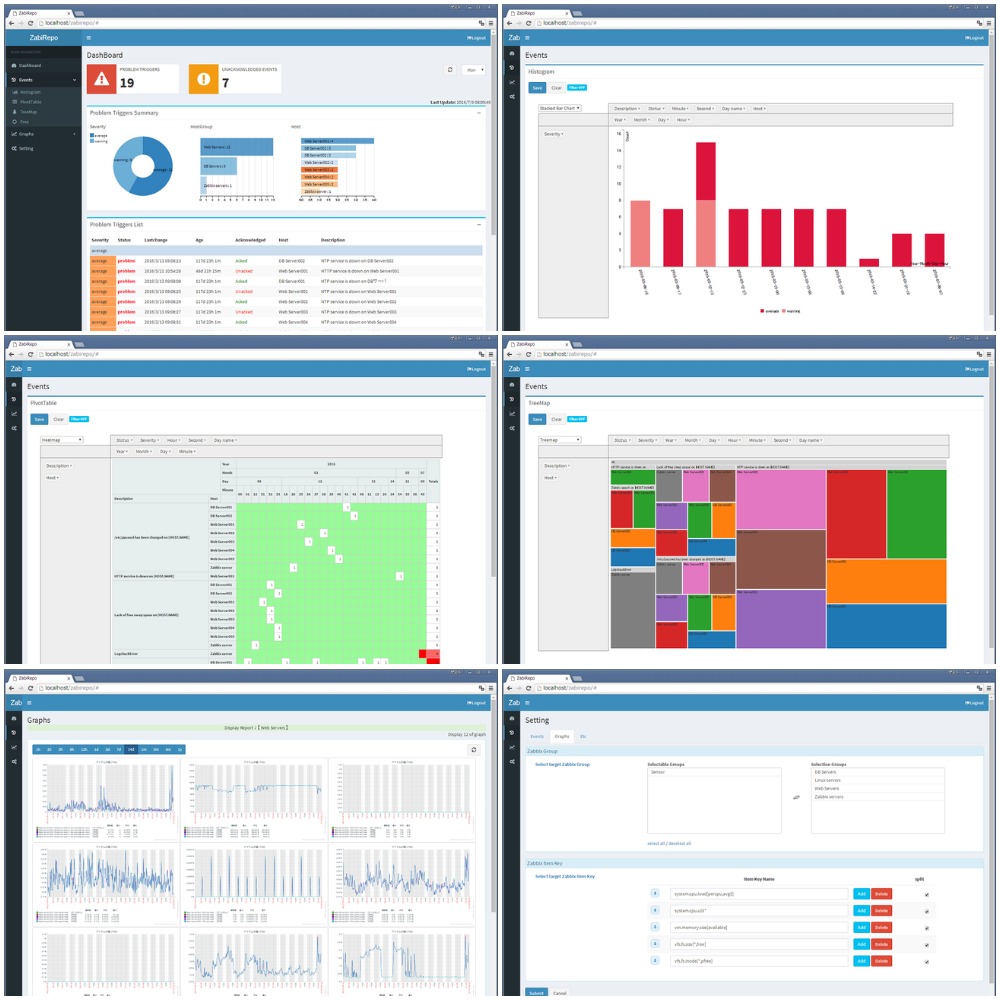
I add about the function which indicates Graph.
UserGraph or SimpleGraph will be registered in the cell by the Zabbix screen function.
But when there are a lot of targets, the work becomes very troublesome.
I want you to see a setting screen in the lower right of capture of ZabiRepo.
It's possible just to set ZabbixGroup and ZabbixItemKey separately and indicate a list of target charts in ZabiRepo.
It isn't necessary to establish combination of ZabbixGroup and ZabbixItemKey.
When I'd like to see many charts, so you can arrive in information needed by very easy operation.
YouTube:
Online Demo
・UserID:guest Password:none
Code is available on Github:

Features
- You can aggregate the Zabbix of events in the pivot table like.
- Aggregate event information can be graphed.
- You can see the list of the graph with a simple operation.
I add about the function which indicates Graph.
UserGraph or SimpleGraph will be registered in the cell by the Zabbix screen function.
But when there are a lot of targets, the work becomes very troublesome.
I want you to see a setting screen in the lower right of capture of ZabiRepo.
It's possible just to set ZabbixGroup and ZabbixItemKey separately and indicate a list of target charts in ZabiRepo.
It isn't necessary to establish combination of ZabbixGroup and ZabbixItemKey.
When I'd like to see many charts, so you can arrive in information needed by very easy operation.
YouTube:

Online Demo
・UserID:guest Password:none

Code is available on Github:


Comment