
Anybody know the status of this request?
Feature request - Stacked Graphs:
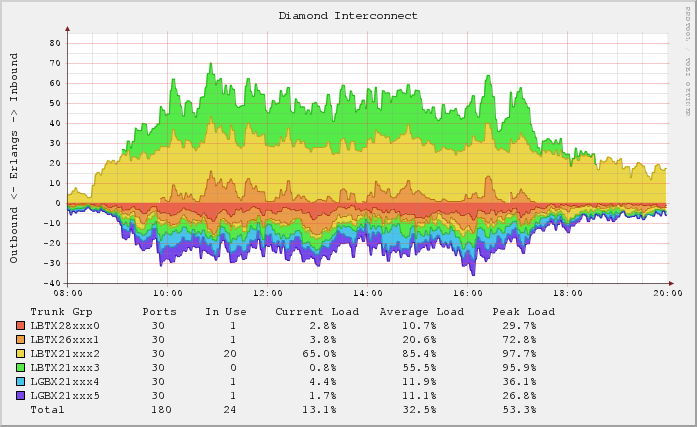
The thing is, as has been mentioned in other posts on this forum, this is something that's pretty easily done in cacti, like in this graph:

Although I know zabbix has monitoring functions that cacti doesn't (at least by default; it has something called thold, which you have to download and install from their forum), but for people like me that need the information presented very concisely, this is a pretty significant feature.
Of course, even cacti doesn't use rrdtool's full potential. Here's a graph from the rrdtool website:
At this point, I've looked at ganglia, cacti, zabbix, munin and groundwork open source, and they all have pretty significant drawbacks. For cacti, it's that it tends be a little labor-intensive; for zabbix, it's because I can't define the graphs the way I want them.
As a previous poster mentioned, this has been requested before:
According to this post, it's not available yet. Any idea of when it will be? Also, how does this differ from a user-defined graph, i.e. from Configuration-> Graph -> Create Graph? I'm not able to specify any graph-specific information, like data source, etc., and so it's no surprise the graph wouldn't show up anywhere.
Feature request - Stacked Graphs:

The thing is, as has been mentioned in other posts on this forum, this is something that's pretty easily done in cacti, like in this graph:
Although I know zabbix has monitoring functions that cacti doesn't (at least by default; it has something called thold, which you have to download and install from their forum), but for people like me that need the information presented very concisely, this is a pretty significant feature.
Of course, even cacti doesn't use rrdtool's full potential. Here's a graph from the rrdtool website:
At this point, I've looked at ganglia, cacti, zabbix, munin and groundwork open source, and they all have pretty significant drawbacks. For cacti, it's that it tends be a little labor-intensive; for zabbix, it's because I can't define the graphs the way I want them.
As a previous poster mentioned, this has been requested before:
According to this post, it's not available yet. Any idea of when it will be? Also, how does this differ from a user-defined graph, i.e. from Configuration-> Graph -> Create Graph? I'm not able to specify any graph-specific information, like data source, etc., and so it's no surprise the graph wouldn't show up anywhere.

Comment