Ad Widget

Collapse

Perfomance. Yes. Performance issue again.

Collapse
X
 
  • Time
  • Show
Clear All
new posts
  • akbar415
    Senior Member
    • May 2015
    • 119

    #1

    Perfomance. Yes. Performance issue again.

    Before started I want to say that I already read this two links
    In the past, quite often Zabbix users have been puzzled regarding some server tuning parameters – for example, how many pollers do they need? It was usually determined based on experience, testing and a bit of guesstimating. No more fuzzy attempts – get hard facts with Zabbix 1.8.5. UPDATED 2011.11.02: new downloadable template version v2 […]


    But I still have the trigger:
    Zabbix poller processes more than 75% busy


    Zabbix Configuration.

    Code:
    StartPollers=420
    StartPollersUnreachable=40
    StartTrappers=40
    StartPingers=10
    StartDiscoverers=10
    StartHTTPPollers=15
    StartJavaPollers=7
    CacheSize=1G
    StartDBSyncers=25
    HistoryCacheSize=256M
    TrendCacheSize=16M
    HistoryTextCacheSize=64M
    ValueCacheSize=16M
    Timeout=7
    Zabbix Status
    Code:
    Number of hosts (enabled/disabled/templates)          191           129 / 14 / 48
    Number of items (enabled/disabled/not supported)	23045	21949 / 513 / 583
    Number of triggers (enabled/disabled [problem/ok])	6780	6555 / 225 [17 / 6538]
    Required server performance, new values per second	270.15	-
    Mysql
    Code:
    /etc/mysql/my.cnf


    When the problem started I raise the value from StartPollers=256 to StartPollers=420 without sucess.
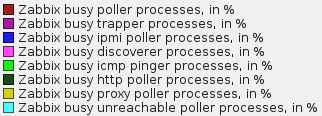
    The others pollers busy process values (HTTP, Java, ping and etc) remains the same in the "Zabbix data gathering process busy %" graph.

    Last edited by akbar415; 15-12-2016, 19:08.
  • kloczek
    Senior Member
    • Jun 2006
    • 1771

    #2
    Very low trapper load and high poller means that you are using mostly "zabbix agent" items instead "zabbix agent (active)" type of items.

    Passive monitoring does not scale above some NVPS and requires muuuuch more server/proxy treads than active one. On some scale switching to active monitoring and active agents as well is only option.
    http://uk.linkedin.com/pub/tomasz-k%...zko/6/940/430/
    https://kloczek.wordpress.com/
    zapish - Zabbix API SHell binding https://github.com/kloczek/zapish
    My zabbix templates https://github.com/kloczek/zabbix-templates

    Comment

    • akbar415
      Senior Member
      • May 2015
      • 119

      #3
      Originally posted by kloczek
      Very low trapper load and high poller means that you are using mostly "zabbix agent" items instead "zabbix agent (active)" type of items.

      Passive monitoring does not scale above some NVPS and requires muuuuch more server/proxy treads than active one. On some scale switching to active monitoring and active agents as well is only option.
      First. Thanks for help me.

      I changed some passive checks items (30% of all items) to active checks. This help me a little. From avg 90% of busy poller to avg 80% of busy poller.

      But this caused me another problem. The zabbix queue for active checks grown up very fast, +250 items in more than 10 minutes queue.


      Sorry for my bad englsih.

      Comment

      • kloczek
        Senior Member
        • Jun 2006
        • 1771

        #4
        Originally posted by akbar415
        First. Thanks for help me.

        I changed some passive checks items (30% of all items) to active checks. This help me a little. From avg 90% of busy poller to avg 80% of busy poller.

        But this caused me another problem. The zabbix queue for active checks grown up very fast, +250 items in more than 10 minutes queue.
        So now you need to go over all agents and replace:
        Server=<your_prx_or_srv_addr>
        by:
        ServerActive=<your_prx_or_rsv_addr>
        StartAgents=0

        This will cause that agents will start deciding when push batches of collected monitoring data to srv/prx.
        Without using active agents setup new bottleneck is created in serialized query agent by agent to read monitoring data.
        http://uk.linkedin.com/pub/tomasz-k%...zko/6/940/430/
        https://kloczek.wordpress.com/
        zapish - Zabbix API SHell binding https://github.com/kloczek/zapish
        My zabbix templates https://github.com/kloczek/zabbix-templates

        Comment

        • akbar415
          Senior Member
          • May 2015
          • 119

          #5
          Originally posted by kloczek
          So now you need to go over all agents and replace:
          Server=<your_prx_or_srv_addr>
          by:
          ServerActive=<your_prx_or_rsv_addr>
          StartAgents=0

          This will cause that agents will start deciding when push batches of collected monitoring data to srv/prx.
          Without using active agents setup new bottleneck is created in serialized query agent by agent to read monitoring data.
          I confiured 10 server to use only active checks. No success.
          But thanks for you help.

          Comment

          • akbar415
            Senior Member
            • May 2015
            • 119

            #6
            Some more information that might help you to help me.

            I added 4 server to be monitored on zabbix server, after that, zabbix server started the "Zabbix poller processes more than 75% busy" trigger.


            I have this problem before, so I known that all I have to do is raise the StartPollers number (256).
            First I set StartPollers = 280 (without success), 300 (without success) ...
            now the value is 420 and I'm still have the problem.

            I tried do disable 4 hosts monitored in server (without success)

            I changed 10 hosts to be monitored only by active checks. (the zabbix queue grew very fast and cause me another issue).

            Nothing appears on the log. (debuglevel=4)

            Performance of zabbix server is fine (memory, cpu).

            I don't know what else I can check.


            Sorry for tha bad Englsih.

            Comment

            • abevern
              Junior Member
              • Apr 2015
              • 10

              #7
              Grave Dig!

              Did you get any resolution on this?

              I'm looking to reduce my "poller busy" numbers too.

              We currently have 200 pollers with 70% busy. We have ~350 nvps load.

              Increasing pollers works to an extent, but you really need to identify things that are tying the pollers up for longer periods. i.e. checks that are particularly expensive.

              I've had some luck by trying to optimise some external checks. Specifically reduce the number of modules and "prettiness" in perl scripts to maximise the speed. I have also re-implemented some perl scripts in bash, as this loads much faster.

              I test optimisations by running them 500 times from the command line.
              i.e.

              Code:
              $ time for i in {1..500} ;do 
              /usr/lib/zabbix/externalscripts/check.pl SERVER >/dev/null 
              done 
              
              real	0m8.372s
              user	0m3.879s
              sys	0m1.516s
              You can get an idea on external checks that take longer by looking at the output of ps -e. Specifcally, pollers that have children are running external checks. If there's a lot running a particular type, then it could be worth looking into.

              Sample below lead me to look more closely at check.pl

              Code:
              $ ps -fuzabbix --forest 
              ....
              zabbix   19947 19765  0 08:30 ?        00:00:06  \_ zabbix_server: poller #177 [got 0 values in 0.000003 sec, getting values]
              zabbix   19948 19765  0 08:30 ?        00:00:07  \_ zabbix_server: poller #178 [got 0 values in 0.000002 sec, getting values]
              zabbix   56279 19948  0 13:30 ?        00:00:00  |   \_ /usr/bin/perl -w /usr/lib/zabbix/externalscripts/check.pl vXXXXXXD087
              zabbix   56290 56279  0 13:30 ?        00:00:00  |       \_ sh -c ping -c 1 -s 56 -w 1 vXXXXXXD087  1>/dev/null 2>/dev/null
              zabbix   56295 56290  0 13:30 ?        00:00:00  |           \_ ping -c 1 -s 56 -w 1 vXXXXXXD087
              zabbix   19949 19765  0 08:30 ?        00:00:06  \_ zabbix_server: poller #179 [got 0 values in 0.000002 sec, idle 1 sec]
              zabbix   19950 19765  0 08:30 ?        00:00:06  \_ zabbix_server: poller #180 [got 0 values in 0.000003 sec, idle 1 sec]
              zabbix   19951 19765  0 08:30 ?        00:00:06  \_ zabbix_server: poller #181 [got 0 values in 0.000002 sec, idle 1 sec]
              If anyone else has some tips on working out what is taking time for the pollers, i'd be interested in hearing.

              Comment

              • kloczek
                Senior Member
                • Jun 2006
                • 1771

                #8
                Why you are using your own custom pinging method if you have build-in pinger?
                http://uk.linkedin.com/pub/tomasz-k%...zko/6/940/430/
                https://kloczek.wordpress.com/
                zapish - Zabbix API SHell binding https://github.com/kloczek/zapish
                My zabbix templates https://github.com/kloczek/zabbix-templates

                Comment

                • abevern
                  Junior Member
                  • Apr 2015
                  • 10

                  #9
                  Originally posted by kloczek
                  Why you are using your own custom pinging method if you have build-in pinger?
                  We have 6 domains, so we wrap fping to try all 6 permutations at the same time. The FQDN isn't known due only being monitored by an "active agent".

                  I just used it as an example, the pinging itself isn't a problem. But there are other external checks that are.

                  Comment

                  • kloczek
                    Senior Member
                    • Jun 2006
                    • 1771

                    #10
                    Originally posted by abevern
                    We have 6 domains, so we wrap fping to try all 6 permutations at the same time. The FQDN isn't known due only being monitored by an "active agent".

                    I just used it as an example, the pinging itself isn't a problem. But there are other external checks that are.
                    ICMP related keys are not "zabbix (active) agent" type of keys but "simple check". You can add pinging to dummy host with registered in interface any hostname or IP you want.
                    As you are using extremalnie checks for every pinged address ostaining every such metric value must be done by separated sub process of zabbix server. With internal pinger over simple checks such process I see paaellized by definition.
                    So I think that you may be wrong if you are doing enough big number of such checks.
                    Despite above you should not be monitoring any metrics over server except zabbix server monitoring over internal checks. Everything else should be moved to proxy or proxies. Why? To simplify workload on server and to have ability to collect monitoring data even when zabbix server is temporary down (maintainacne)
                    http://uk.linkedin.com/pub/tomasz-k%...zko/6/940/430/
                    https://kloczek.wordpress.com/
                    zapish - Zabbix API SHell binding https://github.com/kloczek/zapish
                    My zabbix templates https://github.com/kloczek/zabbix-templates

                    Comment

                    • akbar415
                      Senior Member
                      • May 2015
                      • 119

                      #11
                      Database upgrade

                      Originally posted by abevern
                      Did you get any resolution on this?

                      I'm looking to reduce my "poller busy" numbers too.

                      We currently have 200 pollers with 70% busy. We have ~350 nvps load.

                      Increasing pollers works to an extent, but you really need to identify things that are tying the pollers up for longer periods. i.e. checks that are particularly expensive.

                      I've had some luck by trying to optimise some external checks. Specifically reduce the number of modules and "prettiness" in perl scripts to maximise the speed. I have also re-implemented some perl scripts in bash, as this loads much faster.

                      I test optimisations by running them 500 times from the command line.
                      i.e.

                      Code:
                      $ time for i in {1..500} ;do 
                      /usr/lib/zabbix/externalscripts/check.pl SERVER >/dev/null 
                      done 
                      
                      real	0m8.372s
                      user	0m3.879s
                      sys	0m1.516s
                      You can get an idea on external checks that take longer by looking at the output of ps -e. Specifcally, pollers that have children are running external checks. If there's a lot running a particular type, then it could be worth looking into.

                      Sample below lead me to look more closely at check.pl

                      Code:
                      $ ps -fuzabbix --forest 
                      ....
                      zabbix   19947 19765  0 08:30 ?        00:00:06  \_ zabbix_server: poller #177 [got 0 values in 0.000003 sec, getting values]
                      zabbix   19948 19765  0 08:30 ?        00:00:07  \_ zabbix_server: poller #178 [got 0 values in 0.000002 sec, getting values]
                      zabbix   56279 19948  0 13:30 ?        00:00:00  |   \_ /usr/bin/perl -w /usr/lib/zabbix/externalscripts/check.pl vXXXXXXD087
                      zabbix   56290 56279  0 13:30 ?        00:00:00  |       \_ sh -c ping -c 1 -s 56 -w 1 vXXXXXXD087  1>/dev/null 2>/dev/null
                      zabbix   56295 56290  0 13:30 ?        00:00:00  |           \_ ping -c 1 -s 56 -w 1 vXXXXXXD087
                      zabbix   19949 19765  0 08:30 ?        00:00:06  \_ zabbix_server: poller #179 [got 0 values in 0.000002 sec, idle 1 sec]
                      zabbix   19950 19765  0 08:30 ?        00:00:06  \_ zabbix_server: poller #180 [got 0 values in 0.000003 sec, idle 1 sec]
                      zabbix   19951 19765  0 08:30 ?        00:00:06  \_ zabbix_server: poller #181 [got 0 values in 0.000002 sec, idle 1 sec]
                      If anyone else has some tips on working out what is taking time for the pollers, i'd be interested in hearing.

                      We solve the problem with a hardware upgrade on mysql database (8 GB to 16 Gb RAM)

                      Comment

                      Working...