Ad Widget

Collapse

Can Java Based Applications be monitored in ZABBIX 1.4 ?

Collapse
X
 
  • Time
  • Show
Clear All
new posts
  • standist
    Junior Member
    • Jan 2008
    • 11

    #16
    can I monitor a jdbcconnectionpool is available or not throug jmx

    Can I monitor a jdbcconnectionpool is available or not throug jmx.
    there is some situation like the network connection between tomcat and oracle,so I want to check if the jdbcconnectionpool is available?
    If it is possible, how can I do this.

    Comment

    • areplogle
      Junior Member
      • Oct 2007
      • 16

      #17
      JDBC Connection Pool & Jboss Mbeans in Jconsole

      To get access to Jboss Mbeans from Jconsole see:


      As far as jdbcconnectionpools go, this is what I added:

      jmx[jboss.jca:service=ManagedConnectionPool,name=jdbc/YourDataSource][ConnectionCount]
      jmx[jboss.jca:service=ManagedConnectionPool,name=jdbc/YourDataSource][ConnectionCreatedCount]
      jmx[jboss.jca:service=ManagedConnectionPool,name=jdbc/YourDataSource][ConnectionDestroyedCount]
      jmx[jboss.jca:service=ManagedConnectionPool,name=jdbc/YourDataSource][InUseConnectionCount]
      jmx[jboss.jca:service=ManagedConnectionPool,name=jdbc/YourDataSource][MaxSize]

      This JMX -> Zabbix bridge is awesome!! Thanks so much

      Comment

      • Kees Jan Koster
        Member
        • Oct 2007
        • 83

        #18
        Thank you for the compliment.

        Uhm... What version of Zapcat are you using? I expect that this only works in the (upcoming) Zapcat 1.3 and not in Zapcat 1.2 and older.

        Comment

        • areplogle
          Junior Member
          • Oct 2007
          • 16

          #19
          I'm pretty sure its zapcat 1.2. Why do you think it wouldn't work on that version? I'm getting all of the values back correctly and what not. Seems to be working fine I will note I am using Java 6.


          =]


          Andrew

          Comment

          • areplogle
            Junior Member
            • Oct 2007
            • 16

            #20
            Monitoring JBoss 4.0.4 and up in Zabbix

            While zapcat and the other tools are awesome, if you are using Jboss 4.0.4 or greater for your application server platform, the easiest thing I've found to monitor Jboss is using the snmp-adaptor. It's packaged in the "all" configuration (or you can choose to install it if you use the gui jems installer).

            There are already a few things in the example attributes.xml
            In <JBOSS_HOME>/server/<yourserver>/deploy/snmp-adaptor.sar are the following files:

            attributes.mib -|____________These are the only two you need to modify
            attributes.xml -|
            managers.xml
            notifications.xml
            snmp-adaptor.jar


            Step 1.) Find the attribute you'd like to monitor in the JMX-Console if its not already in the example attributes. (For example, I wanted to monitor ActiveSessions)

            I found WebModule=//localhost/myuri,service=ClusterManager under Jboss.web

            Step 2.) Add the attributes to attributes.xml (I just started where the examples left off at .1.2.3.4.1.11) The attribute names are listed in jmx console under "List of MBean attributes:"

            <!-- Session statistics -->
            <mbean name="jboss.web:service=ClusterManager,WebModule=//localhost/myuri" oid-prefix=".1.2.3.4.1">
            <attribute name="CreatedSessionCount" oid=".11"/>
            <attribute name="ActiveSessionCount" oid=".12"/>
            <attribute name="MaxActiveSessionCount" oid=".13"/>
            </mbean>

            Step 3.) Add the attributes to the attributes.mib as system parameters. The names don't have to match, as long as the OID's match up. Here are mine:

            sessCreatedCount OBJECT-TYPE
            SYNTAX Gauge32
            ACCESS read-only
            STATUS mandatory
            DESCRIPTION
            "The number of total sessions created for this web module"
            ::= { system 11 }
            sessActiveCount OBJECT-TYPE
            SYNTAX Gauge32
            ACCESS read-only
            STATUS mandatory
            DESCRIPTION
            "The number of active sessions for this web module"
            ::= { system 12 }
            sessMaxActiveCount OBJECT-TYPE
            SYNTAX Gauge32
            ACCESS read-only
            STATUS mandatory
            DESCRIPTION
            "The max number of active sessions since jvm inception for this web module"
            ::= { system 13 }


            Step 4.) Startup Jboss and test your new OID entries with snmpwalk!
            I hit my webmodule and got the splash page! Lets see if it see's the session!

            bash-3.2$ snmpwalk.exe -v1 -c public localhost:1261 .1.2.3.4.1.11
            iso.2.3.4.1.11 = Gauge32: 1 <--- Success =]

            Comment

            • otheus
              Member
              • Mar 2009
              • 53

              #21
              Very confused re JMX

              (1.6.3) I am very confused regarding JMX. So the JMX monitoring is "built in", but it requires userConfiguration and specialized java programs to get it to work? Hunh?

              Further, I'm confused because in my distribution, the Java template includes keys like "jmx[java.lang:type=ClassLoading][LoadedClassCount]". That doesn't look like a UserConfiguration parameter, as (now) documented via the post above, which looks like "jvm.maxthreads".

              Is the jmx key above built into the client somehow? Or the server? Can it be?

              Comment

              • mlange
                Member
                • Sep 2008
                • 78

                #22
                To collect JMX values you need to set up the Zapcat agent ont the monitored host (zabbix itself does not know anything on JMX). The agent requests the value from the JMX server locally and sends it to the zabbix server using the zabbix protocol.

                The JMX key is part of the JMX implementation of the monitored hosts (e.g. JDK5, JBoss, Bea, Tomcat...).

                We have set up a pretty large monitoring environment using JMX for JBoss, Weblogic, Tomcat, WSO2 servers and this works excellent.

                Comment

                • Nuscly
                  Junior Member
                  • Dec 2009
                  • 1

                  #23
                  Correction for the jmxproxy.sh script

                  I try the script, but there are mistakes in the sessions.app.* section :

                  replace with this :

                  Code:
                  # -----------------------
                  
                  		sessions.app.active)
                  			getData "Catalina:type=Manager,path=$APPPATH,host=localhost"
                  			$AWK "/^Name\: Catalina\:type=Manager,path=\\$APPPATH/,/^activeSessions\:/" $DATAFILE |\
                  			$AWK '/^activeSessions\:/ { gsub( /[^0123456789]/, "" ); print $1 }'
                  			return $?
                  			;;
                  
                  		sessions.app.maxactive)
                                          getData "Catalina:type=Manager,path=$APPPATH,host=localhost"
                  			$AWK "/^Name\: Catalina\:type=Manager,path=\\$APPPATH/,/^maxActive\:/" $DATAFILE |\
                  			$AWK '/^maxActive\:/ { gsub( /[^0123456789]/, "" ); print $1 }'
                  			return $?
                  			;;
                  
                  		sessions.app.total)
                                          getData "Catalina:type=Manager,path=$APPPATH,host=localhost"
                  			$AWK "/^Name\: Catalina\:type=Manager,path=\\$APPPATH/,/^sessionCounter\:/" $DATAFILE |\
                  			$AWK '/^sessionCounter\:/ { gsub( /[^0123456789]/, "" ); print $1 }'
                  			return $?
                  			;;
                  
                  		sessions.app.expired)
                                          getData "Catalina:type=Manager,path=$APPPATH,host=localhost"
                  			$AWK "/^Name\: Catalina\:type=Manager,path=\\$APPPATH/,/^expiredSessions\:/" $DATAFILE |\
                  			$AWK '/^expiredSessions\:/ { gsub( /[^0123456789]/, "" ); print $1 }'
                  			return $?
                  			;;
                  
                  		sessions.app.age.avg)
                                          getData "Catalina:type=Manager,path=$APPPATH,host=localhost"
                  			$AWK "/^Name\: Catalina\:type=Manager,path=\\$APPPATH/,/^sessionAverageAliveTime\:/" $DATAFILE |\
                  			$AWK '/^sessionAverageAliveTime\:/ { gsub( /[^0123456789]/, "" ); print $1 }'
                  			return $?
                  			;;
                  
                  		sessions.app.age.max)
                                          getData "Catalina:type=Manager,path=$APPPATH,host=localhost"
                  			$AWK "/^Name\: Catalina\:type=Manager,path=\\$APPPATH/,/^sessionMaxAliveTime\:/" $DATAFILE |\
                  			$AWK '/^sessionMaxAliveTime\:/ { gsub( /[^0123456789]/, "" ); print $1 }'
                  			return $?
                  			;;
                  
                  # -----------------------

                  Comment

                  • skajla
                    Junior Member
                    • May 2010
                    • 3

                    #24
                    Jboss Monitoring Using Zabbix

                    Jboss and JVM monitoring
                    JMX stands for Java Management Extensions, and is a facility to allow for remote clients to connect to a JVM, and manage/monitor running applications in that JVM. This management is typically done through MBeans. MBeans are the heart of the JMX specification.

                    In Jboss, JMX is being configured by enabling the JVM setting in "$JBOSS_HOME/bin/run.conf" file with the below mentioned options (stated JMX on 9999 port):
                    JAVA_OPTS="$JAVA_OPTS -Dcom.sun.management.jmxremote.port=9999"
                    JAVA_OPTS="$JAVA_OPTS-Dcom.sun.management.jmxremote.ssl=false"
                    JAVA_OPTS="$JAVA_OPTS-Dcom.sun.management.jmxremote.authenticate=false"


                    In order to monitor the Jboss information, JMX defines a method for Java developers to integrate their applications with existing network management software by dynamically assigning Java objects with management attributes and operations.

                    In Jboss there are two ways that can grab the jmx attribute values.
                    1. Jboss Twiddle utility: A simple command line tool that allows for interaction with a remote JMX server instance. This tool is called twiddle (for twiddling bits via JMX) and is located in the bin directory of the Jboss distribution. The only issue with this tool is it provides very basic information which is not sufficient for monitoring all Jboss parameters.

                    2. JMX Command line utility: This utility allows system administrators to retrieve JMX management data by querying Mbeans directly on Java applications such as memory use, class loaded, garbage collection counts, etc.

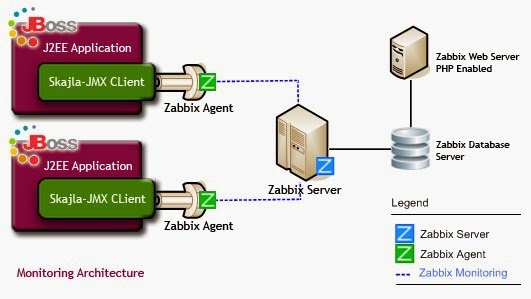
                    I have used Skajla-JMX command line utility (Open Source JMX command line utility specially designed for monitoring Jboss application ) allows the administrator to instrument their Java application with a Zabbix agent. Below mentioned is the monitoring architecture.

                    To capture JVM parameter, first check all available message bean parameters which user can capture using this JMX command line utility, below mentioned is the command:
                    #java -jar skajla-JMXClient.jar <server IP> 9999 <jmxuser> <jmxpassword> info

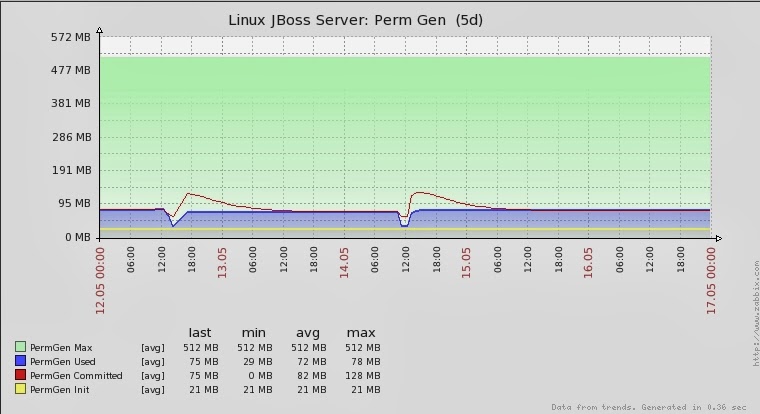
                    e.g Lets say we want to capture ‘PS Perm Gen init memory’, then below mentioned is the command
                    #java -jar skajla-JMXClient.jar 192.168.1.1 9999 admin jmxpassword 'java.lang:type=MemoryPool,name=PS Perm Gen' CollectionUsage init

                    To check the syntax of skajla-JMX client, do the following
                    # java -jar skajla-JMXClient.jar
                    Usage :skajla-JMXClient.jar <ServerId> <port> <jmxuser> <jmxpassword> <Message bean name> <command> <attribute>

                    JMX Command input parameter detail
                    JMX Server IP : IP Address of the jmx server
                    JMX PORT : Port on which JMX service is running
                    JMX USER : Username required to connect to the JMX
                    JMX PASSWORD : Password required to connect to the JMX
                    MESSAGE BEAN : Target Bean for which attribute Value is required
                    COMMAND : Operation to run or attribute to fetch, Attributes begin with
                    a capital letter.
                    ATTRIBUTE : Optional, require in the cases when command output into multiple values


                    Skajla-JMX Command Line Utility and Zabbix Monitoring Architecture
                    Monitoring Network Architecture
                    In order to monitor the Jboss Server, Below mentioned is the minimal Server requirement (Fig. 2 Minimal Monitoring Network Architecture :
                    Zabbix Server
                    Zabbix Database Server
                    Zabbix Web Server
                    Monitoring Server (Depends on the Business Requirement)
                    [
                    IMG]http://4.bp.blogspot.com/_1wCKR1DkzHM/TDQkw_HuanI/AAAAAAAABZg/NN8UBePmIUs/s1600/defaultServerSetup.jpg[/IMG]
                    Zabbix Agent Configuration for jboss Monitoring
                    Below mentioned is the required configuration, which we need to add in the zabbix agent configuration in zabbix_agentd.conf file.
                    Step-1: Add the User Parameter to zabbix agentd configuration file.
                    User parameter has the following syntax:
                    UserParameter=key,command
                    Parameter Description
                    Key Unique Item Key
                    Command Command to be executed to evaluate value of the key.

                    Example : To monitoring Perm Gen init memory, below mentioned is the required configuration
                    UserParameter=permgen_init, java -jar skajla-JMXClient.jar 192.168.1.1 9999 admin jmxpass 'java.lang:type=MemoryPool,name=PS Perm Gen' CollectionUsage init

                    Note: The advantage of using skajla-jmxclient is that it gives only the required value of queried MBean parameter, which eases to capture the information for monitoring.

                    You can easily get other parameter values which you want to monitor by just replacing values of ”java.lang:type=MemoryPool,name=PS Perm Gen with required parameters” in above mentioned userParameter configuration


                    Check http://skajla.blogspot.com/2010/07/j...ng-zabbix.html for more detail and for downloading Zabbix Jboss Linux Template, skajla-jmx Command Line utility
                    Attached Files
                    Last edited by skajla; 07-07-2010, 09:23.

                    Comment

                    • cowmix
                      Junior Member
                      • Jul 2010
                      • 6

                      #25
                      This is great stuff.. Can you post your zabbix agent conf file too?

                      thanks!

                      Originally posted by skajla
                      Jboss and JVM monitoring
                      JMX stands for Java Management Extensions, and is a facility to allow for remote clients to connect to a JVM, and manage/monitor running applications in that JVM. This management is typically done through MBeans. MBeans are the heart of the JMX specification.

                      Comment

                      • skajla
                        Junior Member
                        • May 2010
                        • 3

                        #26
                        Please find zabbix_agentd_java.zip file having information related to the mbeans, which I have configure in the template.
                        Attached Files

                        Comment

                        • cowmix
                          Junior Member
                          • Jul 2010
                          • 6

                          #27
                          Awesome! I'll try this in a few hours.

                          It would be great to update your blog post with this information too...

                          Originally posted by skajla
                          Please find zabbix_agentd_java.zip file having information related to the mbeans, which I have configure in the template.

                          Comment

                          • bashman
                            Senior Member
                            • Dec 2009
                            • 432

                            #28
                            Hi skajla,

                            Your command line utility for monitoring Jboss through jmx is great!.

                            Does it work for tomcat?.
                            978 Hosts / 16.901 Items / 8.703 Triggers / 44 usr / 90,59 nvps / v1.8.15

                            Comment

                            • segaste
                              Junior Member
                              • Feb 2011
                              • 1

                              #29
                              Where I get jmx client?

                              Hi Skajla,

                              I read your excelent article, but the skajla-jmx Command Line utility link is broken. I want to monitor my jboss server and your solution seems interesting to try it. Could you give me another link to download your jmx client??.

                              Thks in advance.

                              Comment

                              Working...