
Hi, I have seen this questions around but not any clue on the missing data.
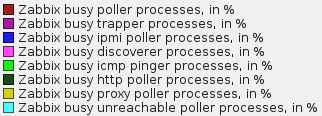
I face this issue of missing graph plot every now and then. In attached graph, i have yellow bar missing, however rest of the all other works fine. Again data appears back.
If its about processor load, its not much during that time it was around or below 1.
If that is due to
### Option: Timeout
# Spend no more than Timeout seconds on processing
#
# Mandatory: no
# Range: 1-30
# Default:
Timeout=20
Its already been checked using 10 now i am testing with 20.
Any potential clue, idea or suggestion.
Attached Files

Comment