Ad Widget

Collapse

Graph Gap

Collapse
X
 
  • Time
  • Show
Clear All
new posts
  • gutotknet
    Junior Member
    • Feb 2012
    • 11

    #1

    Graph Gap

    Hi,
    I'm having some problems with my graphs. I think that can be my hardware, however I don't know how to measure how much I need. See what I have
    -----------------------
    description: CPU
    product: Intel(R) Pentium(R) 4 CPU 3.00GHz
    Memory, 1,5Gb DDR400
    description: ATA Disk product: MB0500EBNCR logical name: /db_mysql
    ATA 160GB for /

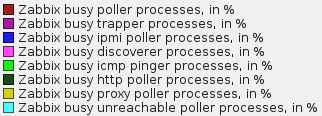
    Attached my "ping" graph gap and summary of zabbix.
    Attached Files
  • Denis Bond
    Junior Member
    • Dec 2013
    • 13

    #2
    Same Issue.
    Once you set the range for several days it seems fine, but turn into the mess once you zoom into 1d or several hours.

    Will appreciate any help.

    Comment

    • ingus.vilnis
      Senior Member
      Zabbix Certified Trainer
      Zabbix Certified SpecialistZabbix Certified Professional
      • Mar 2014
      • 908

      #3
      Hello!

      There might be some Zabbix server performance issues.
      In Zabbix Frontend go to Monitoring -> Graphs select your Zabbix server from top right dropdown and take a look at various server performance graphs. Maybe you will notice some issues there.

      This performance tuning articles could also be useful for you:
      In the past, quite often Zabbix users have been puzzled regarding some server tuning parameters – for example, how many pollers do they need? It was usually determined based on experience, testing and a bit of guesstimating. No more fuzzy attempts – get hard facts with Zabbix 1.8.5. UPDATED 2011.11.02: new downloadable template version v2 […]

      http://www.zabbix.com/img/zabconf201...nce_Tuning.pdf

      If you are using the default settings in your zabbix_server.conf file then try to increase the amount of pollers.

      And check Administration -> Queue . Red fields also indicate performance issues.

      Best regards,
      Ingus

      Comment

      • Denis Bond
        Junior Member
        • Dec 2013
        • 13

        #4
        you know, I've just found this thread. Seems to be useful.
        I have this issue on Gigi interfaces.
        You can take a look at it as well.


        This document describes answers to commonly asked questions about SNMP counters as they relate to Cisco equipment.

        Comment

        • Denis Bond
          Junior Member
          • Dec 2013
          • 13

          #5
          you are right.
          My Queuing looks terrible way off the perfect example they have in the documentation.
          Do you have any idea how to adjust (fix) it.
          Attached Files

          Comment

          • ingus.vilnis
            Senior Member
            Zabbix Certified Trainer
            Zabbix Certified SpecialistZabbix Certified Professional
            • Mar 2014
            • 908

            #6
            You can try to increase the value of "StartPollers" parameter in your zabbix_server.conf file.

            Please report back if that did improve your queue!

            Best Regards,
            Ingus

            Comment

            • Denis Bond
              Junior Member
              • Dec 2013
              • 13

              #7
              This is my zabbix_server.conf file.
              What is a reasonable parameters for the poller settings?

              Thanks for your previous reply. I really appreciate your help.
              Attached Files

              Comment

              • ingus.vilnis
                Senior Member
                Zabbix Certified Trainer
                Zabbix Certified SpecialistZabbix Certified Professional
                • Mar 2014
                • 908

                #8
                You can set it to like 10 or so for a test.

                * Note: you have to uncomment that StartPollers line.

                Restart zabbix_server process after you have made any changes to config file.

                Before and after that please check your Zabbix server performance graphs at Monitoring -> Graphs and filter out your Zabbix server. You will find many interesting stats in the graphs there. Check if changing amount of pollers will make any improvements.

                How many pollers should you have? Well, it depends on the amount of Hosts and Items you monitor. The best is to keep the poller count as low as it keeps your server on low load.
                Last edited by ingus.vilnis; 07-04-2014, 14:46. Reason: typo

                Comment

                • Denis Bond
                  Junior Member
                  • Dec 2013
                  • 13

                  #9
                  Hello again.
                  It seems like an issue is still there after all the changes I did.

                  Comment

                  • Denis Bond
                    Junior Member
                    • Dec 2013
                    • 13

                    #10
                    Another discovery I made indicates that this issue appear only when you want to see the graphs from the Cisco devices.
                    3925 Routers
                    2951 Routers return the solid graphs without any gaps.
                    I wonder if it's related to the items I configured. I executed the snmpwalk on the zabbix box and confirmed I apply the right OIDs to the interfaces. The pollers return the correct values in the table, but shows the broken graph once you click on show the past hour graph.

                    Comment

                    • ingus.vilnis
                      Senior Member
                      Zabbix Certified Trainer
                      Zabbix Certified SpecialistZabbix Certified Professional
                      • Mar 2014
                      • 908

                      #11
                      Try changing option Timeout in zabbix_server.conf and see if it helps.
                      Did you restart zabbix_server after you made changes to conf file?

                      Comment

                      • Denis Bond
                        Junior Member
                        • Dec 2013
                        • 13

                        #12
                        Are you talking about this section?
                        Attached Files

                        Comment

                        • ingus.vilnis
                          Senior Member
                          Zabbix Certified Trainer
                          Zabbix Certified SpecialistZabbix Certified Professional
                          • Mar 2014
                          • 908

                          #13
                          Yes. Let's see if it helps.

                          Comment

                          • Denis Bond
                            Junior Member
                            • Dec 2013
                            • 13

                            #14
                            Negative.
                            Still the same
                            Attached Files

                            Comment

                            • aib
                              Senior Member
                              • Jan 2014
                              • 1615

                              #15
                              Could you confirm that you increase Timeout up to 30, restart Zabbix Server and still getting the graphs with gaps?

                              It would be nice to see any information about this Item from zabbix_server.log
                              Sincerely yours,
                              Aleksey

                              Comment

                              Working...