Ad Widget

Collapse

Zabbix text write cache fills up quickly

Collapse
X
 
  • Time
  • Show
Clear All
new posts
  • RuudH
    Junior Member
    • Nov 2011
    • 11

    #1

    Zabbix text write cache fills up quickly

    Hi,

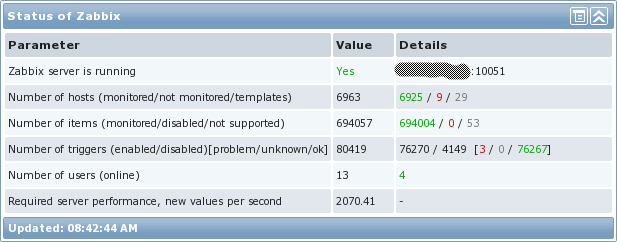
    I'm using a new zabbix 2.2.6 installation on CentOS 6 with only 75 hosts. We do a lot of logfile monitoring (windows logs as well as application logs) , to be able to trigger on specific content.
    Now we have a big issue since the text write cache is going to < 20% in a single day, which leads to Zabbix Server not running anymore (connection errors, no data processing). After restarting the service, everything goes fine but only for one day.
    I've set the HistoryCacheSize already to 512M. I have enough memory in the system (16GB), but I'm wondering if I should adjust this size even more.
    Why does zabbix server not clear the cache ? Or am I misinterpreting things ?
    I haven't split up the mysql db into files per table yet, might that be the cause ? Or should I adjust other settings ?

    Thanks for your help
  • ingus.vilnis
    Senior Member
    Zabbix Certified Trainer
    Zabbix Certified SpecialistZabbix Certified Professional
    • Mar 2014
    • 908

    #2
    Hi,

    What do you have set for HistoryTextCacheSize= in zabbix_server.conf file?

    HistoryCacheSize already to 512M is a huge amount suitable for much bigger instances. I am not sure you need that much.

    DB file per table is a good thing but it is not the problem now.

    But the main thing you have to do is a performance tuning and tune your server.conf according to Zabbix internal performance graphs.
    One of the questions for those of us that use Zabbix on a large scale is “Just how much data can Zabbix ingest before it blows up spectacularly?” Some of the work I’ve been doing lately revolves around that question. I have an extremely large environment (around 32000+ devices) that could potentially be monitored entirely […]


    You can also attach your zabbix_server.conf file + all performance graphs here for us to look at and then maybe we can give you more suggestions.

    Hope this helps!

    Best Regards,
    Ingus

    Comment

    • RuudH
      Junior Member
      • Nov 2011
      • 11

      #3
      Hi Ingus,

      Thnx for your reply
      Attached the performance graphs and configfile as requested.

      Hope you can help me out.
      Attached Files

      Comment

      • ingus.vilnis
        Senior Member
        Zabbix Certified Trainer
        Zabbix Certified SpecialistZabbix Certified Professional
        • Mar 2014
        • 908

        #4
        Hi,

        Ok, two things first:
        1) it would be much more useful for you if you tried to follow all the tips and tuning steps yourself so you would understand what is going on and how all the parameters affect the overall picture. But anyways here will be some suggestions for the config file.
        2) This is for all of the readers - when you post your graphs please make sure they display all the information and there are no legends or other vital information cut off like you have MAX and AVG values unreadable in yours.

        Code:
        StartPollers=25 
        fine, leave it as is.
        
        StartPollersUnreachable=10 
        you have the default 1 running 1 at 100% all the time. 
        Increase this and see changes in graphs. Add more if needed.
        
        StartTrappers=25 
        maybe too much. Can't see max values in graphs
        
        StartDiscoverers=3 
        each process runs one simultaneous discovery. Do you really use them?
        
        StartTimers=5 
        really need that many? Lots of triggers and maintenances used?
        
        VMwareCacheSize=32M  
        I see you run lots of VM's. At minimum 16M here.
        
        # StartDBSyncers=4 
        Good that you left the default. 
        Please never touch this if you really know how it works.
        
        CacheSize=128M 
        OK
        
        HistoryCacheSize=256M 
        OK for now
        
        TrendCacheSize=32M 
        you had 64M which is too much. You don't have so many numeric data.
        
        HistoryTextCacheSize=512M 
        May be tricky. Leave this for now but check graphs later. 
        I suppose the tuning of other parameters will impact on this one as well.
        
        ValueCacheSize=256M 
        OK
        
        Timeout=30 
        careful here. Don't set the max allowed value here unless really needed. 
        Do you have some items that take long to process? 
        If possible, decrease timeout since it affects performance.
        
        # LogSlowQueries=0 
        you may consider setting this to some 3000ms which will be useful 
        if you will have some slow query issues.
        
        ### Remember that each unnecessarily started poller takes a piece of RAM.
        Please follow your server performance regularly to see if everything is ok 
        there and make adjustments if required.
        That's all from my side for now. Hope this helps.

        Best Regards,
        Ingus

        Comment

        Working...