Ad Widget

Collapse

Proxy data senders always busy

Collapse
X
 
  • Time
  • Show
Clear All
new posts
  • abjornson
    Member
    • Oct 2013
    • 34

    #1

    Proxy data senders always busy

    Hello,

    I'm running zabbix 2.4.

    I'm using distributed monitoring with one proxy, and that proxy monitors the majority of my hosts. My performance stats are at the end of this email. My required NVPS is 215, and my server seems to have no issue keeping up with this, as my queue is always low.

    My proxy is geographically far from my server, with 200 ms ping times back to the server. This is unavoidable - and i suspect may be related to the root of the problem

    My question is about the "busy data sender processes" metric on the proxy. No matter what I do, I can't seem to get it to go below ~75-80%. When they saturate at 100%, i see gaps in data collection. I'm frequently getting warnings about this - and it makes me worry about scale as my network is rapidly growing.

    I can't seem to find any parameters to adjust that will make the data senders less busy...and to be honest, I can't even seem to find the bottleneck.

    The server and database does not seem to be the bottleneck It is hosted on Amazon RDS, and i've provisioned it to have a baseline IOPS capacity of much more than what I can see it's using from cloudwatch metrics. I originally did have an issue with insufficient IOPS capacity, and i could see queue issues. Once i grew the db performance, the queue went to 0....but the dataSenders stayed quite busy.

    Does anyone have any suggestions for how i might troubleshoot this?


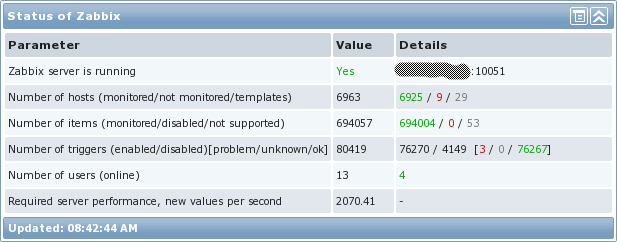
    Here are my stats:
    Number of hosts (enabled/disabled/templates)
    381 326 / 3 / 52

    Number of items (enabled/disabled/not supported)
    60299 37569 / 17412 / 5318

    Required server performance, new values per second
    215.31
  • LenR
    Senior Member
    • Sep 2009
    • 1005

    #2
    I think we had a discussion on this on irc today, but just to get my idea on the forum, I think it may be a LFN (long fat network) problem.

    A packet capture and wireshark might show things like shrinking window size, not using SACK etc.

    Comment

    • abjornson
      Member
      • Oct 2013
      • 34

      #3
      Thanks @LenR - your advice on IRC much appreciated - going to tackle that today and attempt to tune for LFN based on this article http://www.kehlet.cx/articles/99.html

      Comment

      • LenR
        Senior Member
        • Sep 2009
        • 1005

        #4
        I found a blog with a similar situation:
        One of the questions for those of us that use Zabbix on a large scale is “Just how much data can Zabbix ingest before it blows up spectacularly?” Some of the work I’ve been doing lately revolves around that question. I have an extremely large environment (around 32000+ devices) that could potentially be monitored entirely […]


        They seem to say that the application uses short lived connections and won't take advantage of TCP stack window size tuning. I think they just ran multiple proxies.

        What is your DataSenderFrequency value?

        Comment

        • LenR
          Senior Member
          • Sep 2009
          • 1005

          #5
          https://support.zabbix.com/browse/ZBX-5448 also looks interesting

          Comment

          • abjornson
            Member
            • Oct 2013
            • 34

            #6
            Thanks LenR

            Some responses:
            • DataSenderFrequency is still at the default of 1
            • by the way, my ConfigFrequency is 120, down from the default of 3600. But my configuration syncers rarely seem busy. I did this to improve responsiveness when i made changes on the server side.
            • I do think there's something to the latency between proxy and server being part of the issue. After a disruption in proxy internet connectivity....there is a "recovery" period where the queue is large, and that clears in 1-2 hours. However, i notice that the gap in data reported by the proxy actually never fills in. I thought that what the proxy was doing during that time was sending the backlog. I wonder if this is a symptom of something wrong?
            • I agree the blog post you linked is very interesting - he seems to say he found a problem when the proxy had high latency to the server - but I don't think he says if he resolved it?
            • i see in this post https://support.zabbix.com/browse/ZBX-5448 someone said they had better luck with passive proxies than with active in high latency situations. I am using active. I wonder if i should try passive.


            Regarding LFN tuning, I did the TCPdump as you suggested to look at window size and LFN tuning. However, I also did an iperf tcp test. I get 5-10Mbps from my zabbix proxy to my zabbix server (over the higher latency connection). This is much more data than my proxy seems to be using.

            (iperf results)
            [ 3] 0.0-10.8 sec 9.88 MBytes 7.68 Mbits/sec

            If i can push this much data via iperf / TCP doesn't this indicate that it's not an LFN problem?

            Here is a SYN, SYN-ACK, ACK connection setup between proxy and server. Window requested was about 29200. As i watch the packets in the session, I can see larger window values 90000, 100000 being used


            Looking at this post http://serverfault.com/questions/365...-ubuntu-server he seems to say that I would see a lot of WIN=0 packets if i had a windowing problem....but I don't see that in my data.
            Last edited by abjornson; 30-03-2016, 17:57.

            Comment

            • LenR
              Senior Member
              • Sep 2009
              • 1005

              #7
              Do you know how many items you are sending in each sender cycle? increasing the debug level would show that. Your iperf does indicate that the network can pass data, I haven't used iperf in awhile, I seem to remember that it may use it's own methods of windowing. When you know what your items per cycle/items per hour that you current configuration can send, I'd suggest changing DataSenderFrequency to a higher value, maybe 10.

              My thought, your sender takes some time to send it's appox 250 (I think that was your NVPS value), waits 1 sec, then repeats, but it can't quite send 250 values in that time due to the latency. Increasing the wait part of the cycle might get the proxy to try to send 2500 items (10 x more) and that would let the tcp windowing take effect, and it could get them sent in a reasonable time. The proxy may be suffering from latency in the way it uses short lived TCP sessions.

              Do you have many discovery (LLD) rules? If so, do they have a frequent update interval? I don't know if they count in the NVPS values, but one other problems discussed that they were sending a lot of data. I know that LLD update intervals get shortened when they are being developed and sometimes we forget to set a reasonable interval.

              I think one solution one of the other cases was running multiple, smaller proxies at the remote location.

              From what you learn from that 10 second value, adjustments could be made.

              Comment

              • abjornson
                Member
                • Oct 2013
                • 34

                #8
                I didn't realize I had to turn up the logging on Data Sender two levels from default to get the count of how many items were sent....now I'm seeing the counts.

                Below is an excerpt from grep "data sender \[" zabbix_proxy.log

                You can see the how many values sent varies greatly, sometimes 0, sometimes as high as 3000.

                I do use a lot of LLD rules - I should look at adjusting the intervals on those...I can see one of the posts you'd linked above mentions that.


                19199:20160330:231608.765 data sender [sent 0 values in 0.002220 sec, idle 1 sec]
                19199:20160330:231609.766 data sender [sent 0 values in 0.002220 sec, sending data]
                19199:20160330:231613.689 data sender [sent 1043 values in 3.923095 sec, idle 1 sec]
                19199:20160330:231614.689 data sender [sent 1043 values in 3.923095 sec, sending data]
                19199:20160330:231619.833 data sender [sent 1205 values in 5.143469 sec, idle 1 sec]
                19199:20160330:231620.833 data sender [sent 1205 values in 5.143469 sec, sending data]
                19199:20160330:231629.206 data sender [sent 2314 values in 8.372793 sec, idle 1 sec]
                19199:20160330:231630.206 data sender [sent 2314 values in 8.372793 sec, sending data]
                19199:20160330:231632.972 data sender [sent 999 values in 2.766058 sec, idle 1 sec]
                19199:20160330:231633.973 data sender [sent 999 values in 2.766058 sec, sending data]
                19199:20160330:231637.944 data sender [sent 840 values in 3.971113 sec, idle 1 sec]
                19199:20160330:231638.944 data sender [sent 840 values in 3.971113 sec, sending data]
                19199:20160330:231638.948 data sender [sent 0 values in 0.003700 sec, idle 1 sec]
                19199:20160330:231639.948 data sender [sent 0 values in 0.003700 sec, sending data]
                19199:20160330:231643.724 data sender [sent 967 values in 3.775516 sec, idle 1 sec]
                19199:20160330:231644.724 data sender [sent 967 values in 3.775516 sec, sending data]
                19199:20160330:231648.283 data sender [sent 941 values in 3.559495 sec, idle 1 sec]
                19199:20160330:231649.284 data sender [sent 941 values in 3.559495 sec, sending data]
                19199:20160330:231653.730 data sender [sent 1129 values in 4.446285 sec, idle 1 sec]
                19199:20160330:231654.730 data sender [sent 1129 values in 4.446285 sec, sending data]
                19199:20160330:231702.643 data sender [sent 1930 values in 7.912965 sec, idle 1 sec]
                19199:20160330:231703.643 data sender [sent 1930 values in 7.912965 sec, sending data]
                19199:20160330:231709.013 data sender [sent 1209 values in 5.369395 sec, idle 1 sec]
                19199:20160330:231710.013 data sender [sent 1209 values in 5.369395 sec, sending data]
                19199:20160330:231714.873 data sender [sent 1269 values in 4.859713 sec, idle 1 sec]
                19199:20160330:231715.873 data sender [sent 1269 values in 4.859713 sec, sending data]
                19199:20160330:231725.246 data sender [sent 2538 values in 9.372828 sec, idle 1 sec]
                19199:20160330:231726.246 data sender [sent 2538 values in 9.372828 sec, sending data]
                19199:20160330:231738.883 data sender [sent 3091 values in 12.636309 sec, idle 1 sec]
                19199:20160330:231739.883 data sender [sent 3091 values in 12.636309 sec, sending data]
                19199:20160330:231742.323 data sender [sent 699 values in 2.440359 sec, idle 1 sec]
                19199:20160330:231743.323 data sender [sent 699 values in 2.440359 sec, sending data]
                19199:20160330:231743.327 data sender [sent 0 values in 0.003815 sec, idle 1 sec]
                19199:20160330:231744.327 data sender [sent 0 values in 0.003815 sec, sending data]
                19199:20160330:231745.515 data sender [sent 460 values in 1.187644 sec, idle 1 sec]
                19199:20160330:231746.515 data sender [sent 460 values in 1.187644 sec, sending data]

                Comment

                • abjornson
                  Member
                  • Oct 2013
                  • 34

                  #9
                  I decided to go ahead and change from active to passive proxy based on some of the comments on this issue https://support.zabbix.com/browse/ZBX-5448

                  I changed to passive proxy, and I increased the StartProxyPollers on the server side from default of 1 to 4.

                  I'll have to let it run for a while to see the result. Initially, it looks like my queue is maybe not keeping up as well...but it's hard to say with just a small amount of data.

                  Comment

                  • abjornson
                    Member
                    • Oct 2013
                    • 34

                    #10
                    First day of running with my proxy converted to passive.

                    All seems well, though I can't tell if i've traded one problem (busy data senders on the proxy) for another (busy proxy pollers on the server)

                    When I had just one proxy poller, it was showing 80% busy. I added a total of 4, and that makes it show that the proxy pollers are not busy...but I'm not sure that this accurately reflects the situation...because zabbix server seems to only point one proxy poller at a proxy.

                    Performance seems ok so far - but I'm still not seeing the zabbix proxy using increased bandwidth, which I would have maybe expected if i'd cleared the bottleneck....maybe still need to look at LFN tuning.

                    Comment

                    Working...