
I'm having an issue where graph values don't correspond with numerical values. For example, i am monitoring bandwidth for eth ports on my firewall, and supposedly the maximum value in a period is 6 Mbps, but the graph only displays values up to 3 Mbps.
I opened a bug (https://support.zabbix.com/browse/ZBX-11074) and i was told that i didn't create the graph properly since i used AVG values.
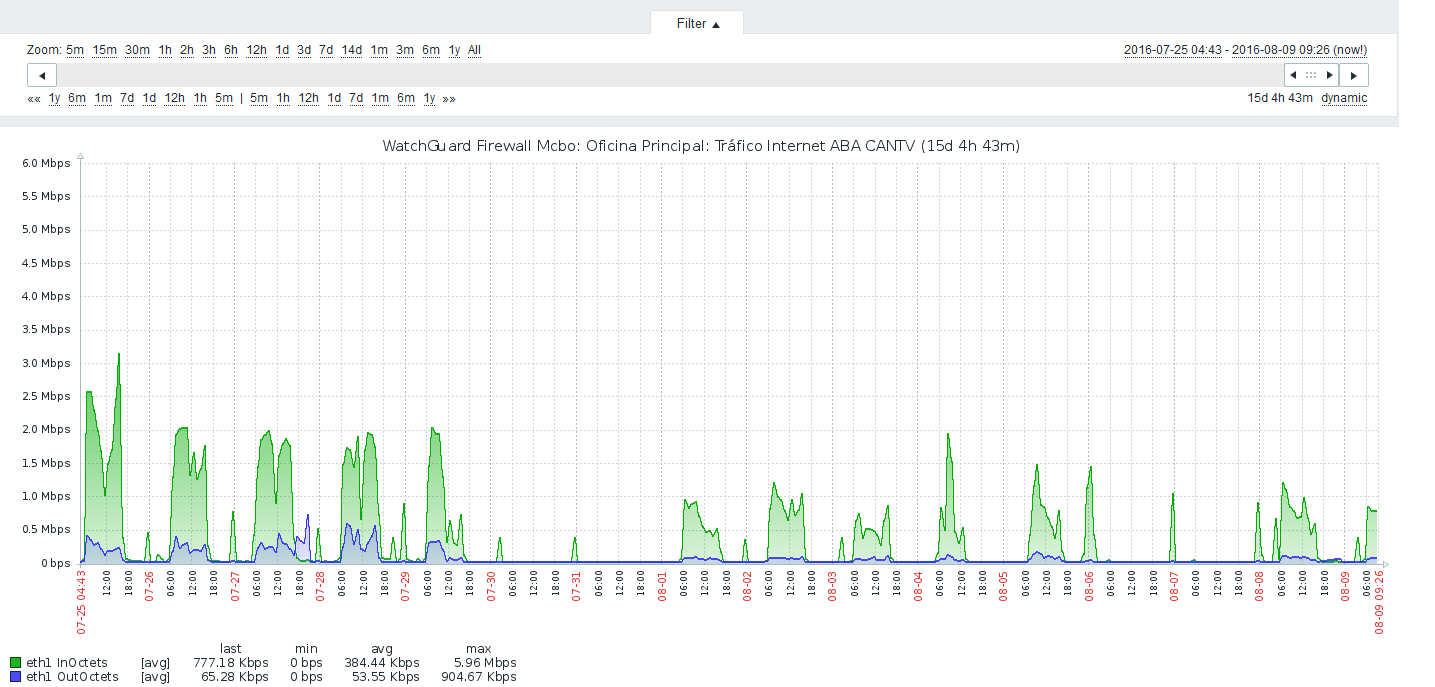
From the bug linked above, here's a screenshot of my graph with AVG values:
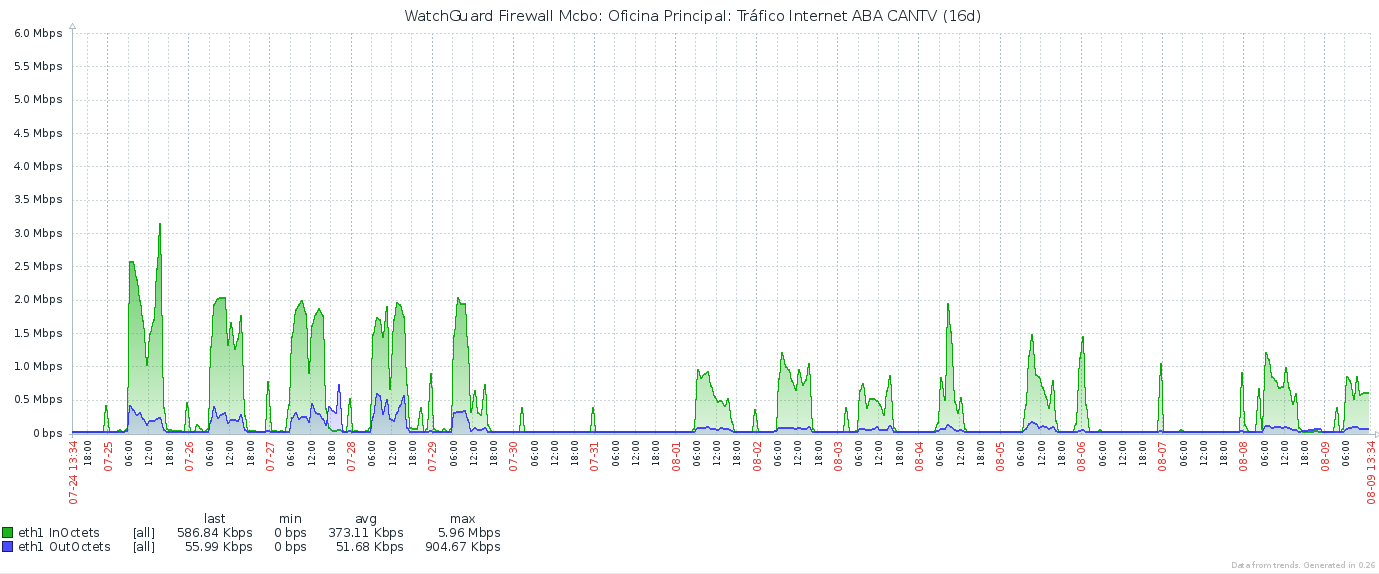
And here's one after i modified the graph to use ALL values:
As you can see, they look exactly the same.
The values InOctets / OutOctets are being read once per minute. If there is just one value per read, avg and all shouldn't differ, hence the graphs.
If you look closely at the graphs you can see i set a zoom filter of 16 days (because we started having an issue on july 26). If i put the zoom level back to the default (dynamic 1 hour) then the numerical values do correspond with the graph pixels.
Am i wrong? Is there a bug? Please advice. This is on zabbix 3.04 on debian 8 fully updated, installed from the official zabbix repository.
I opened a bug (https://support.zabbix.com/browse/ZBX-11074) and i was told that i didn't create the graph properly since i used AVG values.
From the bug linked above, here's a screenshot of my graph with AVG values:
And here's one after i modified the graph to use ALL values:
As you can see, they look exactly the same.
The values InOctets / OutOctets are being read once per minute. If there is just one value per read, avg and all shouldn't differ, hence the graphs.
If you look closely at the graphs you can see i set a zoom filter of 16 days (because we started having an issue on july 26). If i put the zoom level back to the default (dynamic 1 hour) then the numerical values do correspond with the graph pixels.
Am i wrong? Is there a bug? Please advice. This is on zabbix 3.04 on debian 8 fully updated, installed from the official zabbix repository.

Comment