
- 5 Novedades de Zabbix 6.0.0
- Widgets
- Funciones
- Métricas
- Preprocesamiento
- Macros
- Bases de datos
- Procesos
- Recarga de parámetros de usuario sin reiniciar el agente
- Soporte PCRE2
- Zabbix obtiene y tiempo de espera del remitente de Zabbix
- Funcionalidad de puerta de enlace SNMP ampliada
- Procesamiento independiente para comprobaciones ODBC
- Transferencia de comandos en tiempo de ejecución
- Controles de tiempo de ejecución en sistemas operativos basados en BSD
- Complementos del agente 2 de Zabbix
- Plantillas
- Notificaciones
- Interfaz
- Requisitos de contraseña
- Registro de auditoría
- La vinculación de plantillas es más visible
- Subfiltro en los datos más recientes
- Mejoras de usabilidad para gráficos personalizados
- Creación de equipos desde Monitoreo
- Edición de equipo como ventana emergente
- Mejor navegación entre la configuración de métricas y los datos más recientes
- Monitoreo → Últimos datos actualizados
- Se eliminó la sección Visión general de Monitoreo →
- Varios
- Cambios importantes
5 Novedades de Zabbix 6.0.0
Consulte los cambios importantes para esta versión.
Clúster de alta disponibilidad para el servidor Zabbix
La nueva versión viene con una solución nativa de alta disponibilidad para Servidor Zabbix.
La solución consta de múltiples instancias o nodos zabbix_server, donde sólo un nodo puede estar activo (trabajando) a la vez, mientras que otros nodos están en espera, listos para tomar el control en caso de que el nodo actual se detenga o falle.
Consulte también: Clúster de alta disponibilidad.
Monitoreo de servicio actualizado
Se han realizado varias actualizaciones en el seguimiento de servicios. El monitoreo de servicios ofrece una vista de alto nivel de la infraestructura monitoreada en Zabbix.
Mapeo basado en etiquetas de servicios a problemas
La disponibilidad de servicios en versiones anteriores de Zabbix dependía de los iniciadores y sus estados. En la nueva versión que se reemplaza por una asignación basada en etiquetas a problemas para el servicio respectivo.
En la configuración del servicio, ya no existen dependencias duras y blandas. En cambio, un servicio puede tener varios servicios principales.
Menú de servicios
Ahora hay un nuevo menú de servicios en Zabbix, con cuatro secciones de menú:
- Servicios - para la descripción general y la configuración del servicio (movido de Monitoreo -> Servicios)
- Acciones de servicio - para acciones de servicio (nuevo tipo de acción)
- SLA - para configurar SLA
- Informe de SLA - para informes de SLA (también disponible como widget de panel)
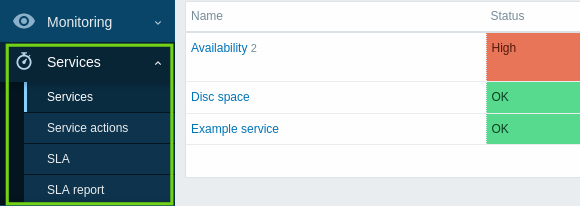
Tenga en cuenta que se incluye un menú de servicios independiente La sección para la configuración del servicio ya no existe (antes estaba en Configuración → Servicios).
Cálculo de estado y reglas de propagación
Hay nuevas reglas de cálculo de estado y reglas adicionales flexibles para calcular el estado de un servicio principal basadas en los estados y el peso de los hijos directos. Ahora también es posible establecer reglas flexibles para propagar un estado del servicio a los servicios padres.
Permisos
Se han implementado permisos flexibles para los servicios a nivel de rol de usuario. Se puede otorgar acceso de lectura, escritura o solo lectura a todos, a ninguno o a servicios seleccionados (según el nombre o las etiquetas).
Análisis de raíz de la causa
Una nueva columna Causa raíz enumera los problemas subyacentes que afectan directa o indirectamente el estado del servicio.
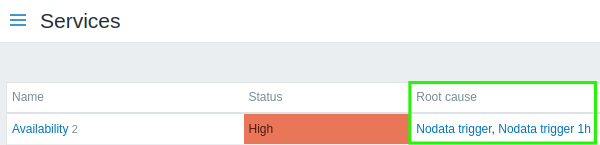
Si hace clic en el nombre del problema podrá ver más detalles al respecto en Monitoreo → Problemas.
Alertas sobre cambios en el estado del servicio
Ahora es posible recibir alertas automáticas sobre cambios en el estado del servicio, similares a las alertas sobre cambios en el estado de los iniciadores.
Se ha agregado una nueva funcionalidad de acción de servicio, similar a otras acciones en Zabbix. Las acciones de servicio pueden incluir pasos para operaciones de problemas, recuperación y actualización relacionadas con los servicios. Es posible configurar dos tipos de acciones: enviar un mensaje a los destinatarios especificados y ejecutar un comando remoto en el servidor Zabbix. De manera similar a las acciones de activación, las acciones de servicio admiten escenarios de escalada de problemas.
Se han agregado nuevas plantillas de mensajes Servicio, Recuperación de servicio y Actualización de servicio a los tipos de medios y deben definirse para permitir el envío correcto de notificaciones para acciones de servicio.
Clonación de servicios
Ahora es posible clonar servicios. Se ha añadido el botón Clonar al formulario de configuración de un servicio. Cuando se clona un servicio, se conservan sus vínculos principales, mientras que los vínculos secundarios no.
Widgets
Se han añadido varios widgets de tablero en la nueva versión.
Equipos principales
Se ha agregado un widget de Equipos principales a los widgets de tablero. Este widget está diseñado para reemplazar el widget Descripción general de datos que ahora está obsoleto.
El widget Equipos principales permite crear tablas personalizadas para la descripción general de los datos, lo que resulta útil para informes similares a Top N e informes de progreso de barras útiles para la planificación de la capacidad.

Para obtener más información, consulte Widget Equipos principales.
Valor de métrica
Se ha añadido un widget de Valor de métrica a los widgets de tablero.
Este tipo de widget es útil para mostrar valores de métricas individuales de forma destacada. Son posibles distintos estilos visuales de visualización:

Para obtener más información, consulte Widget de valor de métrica.
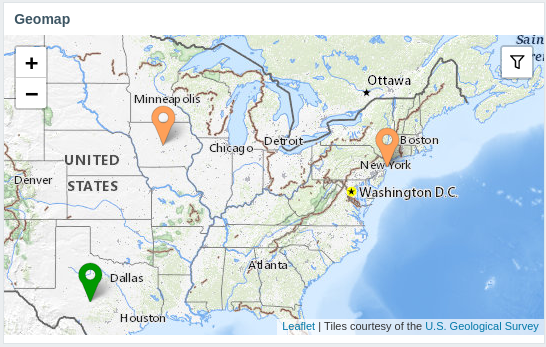
Geomap
Se ha introducido un nuevo widget de geomap para los tableros que ofrece una forma de mostrar los equipos en mapas geográficos. Para obtener más información, consulte el widget de tablero y mapas geográficos.
Funciones
Funciones para histogramas de Prometheus
Hace ya un tiempo que es posible recopilar métricas de Prometheus en Zabbix, pero es difícil trabajar con algunas de las métricas. En concreto, las métricas de tipo histograma se pueden presentar en Zabbix como métricas múltiples con los mismos nombres de clave, pero con diferentes parámetros. Sin embargo, aunque dichas métricas están relacionadas lógicamente y representan los mismos datos, ha sido difícil analizar los datos recopilados sin funciones especializadas. Para cubrir esta brecha de funcionalidad en la nueva versión, se han añadido las funciones rate() y histogram_quantile(), que producen el mismo resultado que sus contrapartes de PromQL.
Otras nuevas incorporaciones para complementar esta funcionalidad son las funciones bucket_rate_foreach() y bucket_percentile(). Para obtener más información, consulte:
- Funciones de historial (consulte rate())
- Funciones de agregación (consulte histogram_quantile(), bucket_percentile())
- Funciones Foreach (consulte bucket_rate_foreach())
Cambio monótono
Ahora es posible verificar el aumento o disminución monótona en los valores de las métricas usando las nuevas funciones de historial monoinc() o monodec().
Recuento de cambios
Se ha añadido una nueva función de historial changecount() que permite contar la cantidad de cambios entre valores adyacentes. La función admite tres modos diferentes para contar todos los cambios, solo las disminuciones o solo los aumentos. Por ejemplo, se puede utilizar para realizar un seguimiento de los cambios en la cantidad de usuarios o la cantidad de disminuciones del tiempo de actividad del sistema.
Recuento de entidades
Se han agregado nuevas funciones para simplificar el recuento de equipos, métricas o valores específicos, devueltos por funciones foreach.
Funciones agregadas:
- count - número total de valores en una matriz devueltos por una función foreach (devuelve un entero);
- item_count - número total de métricas actualmente habilitadas que coinciden con los criterios de filtro (devuelve un entero).
Función foreach:
- exists_foreach - número de métricas actualmente habilitadas que coinciden con los criterios de filtro (devuelve una matriz).
Monitoreo de línea base
El conjunto de opciones de monitoreo de línea base disponibles se ha ampliado con las dos nuevas funciones baselinedev y baselinewma.
- baselinedev: compara el último período de datos con los mismos períodos de datos en temporadas anteriores y devuelve el número de desviaciones;
- baselinewma: calcula la línea base promediando los datos del mismo período de tiempo en múltiples períodos de tiempo iguales ('temporadas') utilizando el algoritmo de promedio móvil ponderado.
En el contexto de estas funciones, el término 'temporada' se refiere a un período de tiempo configurable, que puede ser horas, días, semanas, meses o años. La duración de una temporada y el número de temporadas a analizar se establece en los parámetros de la función.
Consulte funciones de historial para obtener más información.
Detección de anomalías
Zabbix 5.2 introdujo nuevas funciones de tendencia útiles para el monitoreo de referencia. Sin embargo, aún requieren definir umbrales relativos (por ejemplo, verificar que el tráfico web en septiembre de 2021 sea menos del doble en comparación con septiembre de 2020). Hay casos de uso en los que dichos umbrales son difíciles de definir. Por ejemplo, el tráfico web de un sitio web nuevo pero muy popular puede crecer orgánicamente muchas veces a lo largo de un año, pero la tasa de crecimiento es desconocida. Sin embargo, un aumento repentino del tráfico debido a un ataque DDOS debe generar una alerta independientemente del crecimiento del tráfico orgánico.
Los algoritmos de detección de anomalías hacen exactamente esto: encuentran datos que no parecen normales (valores atípicos) en un contexto de otros valores.
Se agregó la nueva función de tendencia trendstl() que utiliza el método de "descomposición" para calcular la tasa de anomalías. Divide una secuencia de series temporales única en otras tres secuencias:
- secuencia de tendencia que solo contiene grandes cambios en los datos originales (p. ej., el tráfico del sitio web muestra un crecimiento)
- secuencia estacional que solo contiene cambios estacionales (p. ej., menos tráfico del sitio web en verano, más en otoño)
- secuencia residual que solo contiene valores residuales que no se pueden interpretar como partes de la tendencia o la temporada
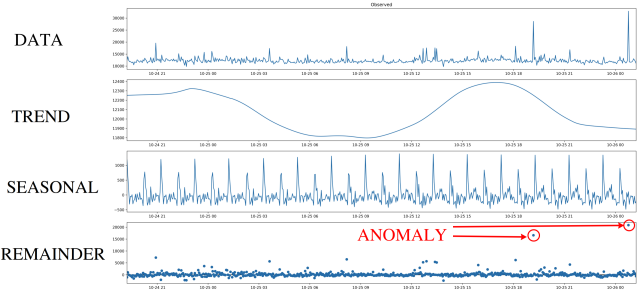
La detección de anomalías funciona con la secuencia residual y verifica si hay valores que están demasiado lejos de la mayoría de los valores residuales. "Lejos" significa que el valor absoluto de la secuencia residual es N veces mayor que la desviación estándar o media.
Funciones de cadena
La función de cadena concat ahora permite concatenar más de dos parámetros. Se puede utilizar para combinar cadenas y valores en diferentes combinaciones o para agregar dos o más valores entre sí. También se admiten tipos de datos numéricos.
Métricas
Selección de tipo automatizada
El formulario de configuración de métricas ahora sugiere automáticamente el tipo de información coincidente, si la clave de la métrica seleccionada devuelve solo datos del tipo específico (por ejemplo, la métrica log[] requiere Tipo de información: Registro). El parámetro Tipo de información ahora se encuentra debajo del parámetro Clave en la pestaña Métrica principal y se duplica en la pestaña Preprocesamiento si se especifica al menos un paso de preprocesamiento. Si Zabbix detecta una posible falta de coincidencia del tipo de información y la clave seleccionados, se mostrará un ícono de advertencia junto al campo Tipo de información.
Métricas del agente
Se han agregado varias métricas nuevas al agente Zabbix/agente 2:
- agent.hostmetadata: devuelve metadatos del equipo
- kernel.openfiles: devuelve la cantidad de descriptores de archivos abiertos
- net.tcp.socket.count[]: devuelve la cantidad de sockets TCP que coinciden con los parámetros
- net.udp.socket.count[]: devuelve la cantidad de sockets UDP que coinciden con los parámetros
- vfs.dir.get[]: devuelve una lista de archivos de directorio como JSON
- vfs.file.get[]: devuelve información sobre un archivo como JSON
- vfs.file.owner[]: devuelve la propiedad de un archivo
- vfs.file.permissions[]: devuelve una cadena de 4 dígitos que contiene un número octal con permisos Unix
Adicionalmente:
- vfs.file.cksum[] ahora admite un segundo parámetro
mode(crc32, md5, sha256) - vfs.file.size[] ahora admite un segundo parámetro
mode(bytes o lines) - vfs.fs.discovery y vfs.fs.get ahora devuelven una macro {#FSLABEL} en Windows (con nombres de volumen)
Para obtener más detalles, consulte métricas del agente.
Métricas calculadas
Las métricas calculadas ahora admiten tipos de información no solo numéricos, sino también de texto, registro y caracteres.
Procesamiento masivo de métricas de Prometheus
Se ha introducido el procesamiento masivo de métricas dependientes en la cola de preprocesamiento para mejorar el rendimiento de la recuperación de métricas de Prometheus.
Consulte Verificaciones de Prometheus para obtener más detalles.
Métodos de JavaScript
Se han añadido los métodos HTTP PATCH, HEAD, OPTIONS, TRACE y CONNECT al motor de JavaScript. Además, el motor ahora permite enviar solicitudes de métodos HTTP personalizados con el nuevo método JS HttpRequest.customRequest.
Consulte también: Objetos JavaScript adicionales.
Contenido comprimido en la monitorización web
Se ha añadido a la monitorización web de Zabbix la capacidad de manejar contenido comprimido. Se admiten todos los formatos de codificación compatibles con libcurl.
Preprocesamiento
Lenguaje de consulta de Prometheus
El lenguaje de consulta de preprocesamiento de Zabbix Prometheus ahora admite dos operadores de coincidencia de etiquetas adicionales:
- != -- selecciona etiquetas que no son iguales a la cadena proporcionada;
- !\~ -- selecciona etiquetas que no coinciden con la cadena proporcionada mediante expresiones regulares.
Procesamiento de resultados para el patrón Prometheus
Un paso del patrón Prometheus en el preprocesamiento puede producir un resultado en el que coinciden varias líneas. Para manejar esta situación, se ha agregado un nuevo parámetro de procesamiento de resultados al paso de preprocesamiento del patrón Prometheus que permite agregar los datos de múltiples líneas coincidentes al introducir funciones como suma, mínimo, máximo, promedio y recuento.
Macros
Nuevas macros
Ahora se admiten nuevas macros para la depuración de expresiones de iniciador y acciones internas.
Las macros de depuración de expresiones simplifican el proceso de depuración de expresiones de iniciador:
- {TRIGGER.EXPRESSION.EXPLAIN}, {TRIGGER.EXPRESSION.RECOVERY.EXPLAIN} - resuelven parcialmente el iniciador evaluado o expresión de recuperación, donde solo se aplican funciones basadas en métricas;
- {FUNCTION.VALUE<1-9>}, {FUNCTION.RECOVERY.VALUE<1-9>} - resuelven los resultados de la enésima función basada en métricas en el momento del evento.
Las macros para acciones internas contienen el motivo por el cual una métrica, una regla LLD o un iniciador dejaron de ser compatibles:
- {ITEM.STATE.ERROR} - para notificaciones internas basadas en métricas;
- {LLDRULE.STATE.ERROR} - para notificaciones internas basadas en reglas LLD;
- {TRIGGER.STATE.ERROR}: para notificaciones internas basadas en iniciadores.
Para obtener más detalles, consulte Macros compatibles.
Macros simples reemplazadas por macros de expresión
En Zabbix 5.4 se introdujo una nueva sintaxis de expresión para iniciadores y métricas calculadas. Sin embargo, la sintaxis anterior seguía utilizándose en macros simples. En la nueva versión, la funcionalidad de las macros simples se ha transferido a las macros de expresión y se utiliza la nueva sintaxis de expresión. Consulte la comparación a continuación para obtener detalles del cambio:
| En Zabbix 6.0 | Antes de Zabbix 6.0 |
|---|---|
{?avg(/host/key,1h)}Ejemplo de una macro de expresión en la nueva versión. |
{host:key.avg(1h)}Ejemplo de una macro simple en versiones anteriores. |
Las macros simples existentes se convertirán en macros de expresión durante la actualización. El alcance de las macros de expresión cubre lo mismo que ofrecían las macros simples. Por lo tanto, las macros de expresión se pueden utilizar en:
- notificaciones y comandos de problemas
- notificaciones y comandos de actualización de problemas
- etiquetas de elementos de mapa
- etiquetas de vínculos de mapa
- etiquetas de formas de mapa
- nombres de gráficos
Las macros posicionales ya no son compatibles
La compatibilidad con macros posicionales en el nombre de la métrica ($1, $2...$9), obsoleta desde Zabbix 4.0, se ha eliminado por completo.
Ya no se admiten macros de usuario en el nombre de la métrica
La compatibilidad con macros de usuario en nombres de métricas (incluidos los nombres de reglas de descubrimiento), obsoleta desde Zabbix 4.0, ha sido completamente eliminada.
Bases de datos
Para crear una experiencia de usuario óptima y garantizar el mejor rendimiento de Zabbix en varios entornos de producción, se ha dejado de brindar soporte a algunas versiones de bases de datos más antiguas. Esto se aplica principalmente a las versiones de bases de datos que están a punto de finalizar su vida útil y a las versiones con problemas sin solucionar que pueden interferir con el rendimiento normal.
A partir de Zabbix 6.0, las siguientes versiones de base de datos son oficialmente compatibles:
- MySQL/Percona 8.0.X
- MariaDB 10.5.X - 10.6.X
- PostgreSQL 13.X - 14.X
- Oracle 19c - 21c
- TimescaleDB 2.0.1-2.3
- SQLite 3.3.5-3.34.X
De manera predeterminada, el servidor y el proxy de Zabbix no se iniciarán si se detecta una versión de base de datos no compatible. Ahora es posible, aunque no se recomienda, desactivar la verificación de la versión de la base de datos modificando el parámetro de configuración AllowUnsupportedDBVersions para el servidor o el proxy.
Claves primarias
Las claves primarias ahora se utilizan para todas las tablas, incluidas las tablas de historial, en las nuevas instalaciones.
No hay una actualización automática de las claves primarias para las instalaciones existentes. Las instrucciones para una actualización manual de las tablas de historial a claves primarias en instalaciones preexistentes están disponibles para MySQL/MariaDB, PostgreSQL, TimescaleDB v1 y v2, y Oracle.
Compatibilidad con utf8mb4 para MySQL
La codificación utf8mb4 con intercalación utf8mb4_bin ahora es compatible con las instalaciones de Zabbix con la base de datos MySQL/MariaDB.
Anteriormente, solo se admitía la codificación utf8, que con MySQL significa codificación utf8mb3 y, por lo tanto, solo admite un subconjunto de caracteres UTF-8 adecuados. En la nueva versión, se agregó compatibilidad con utf8mb4 con compatibilidad con el conjunto de caracteres UTF-8 completo . Las instalaciones antiguas que usan utf8mb3 se mantienen intactas y pueden seguir usando esa codificación.
Consulte también las instrucciones sobre cómo ejecutar la conversión utf8mb4 después de la actualización a la versión 6.0.
Procesos
Recarga de parámetros de usuario sin reiniciar el agente
Los parámetros de usuario ahora se pueden recargar desde el archivo de configuración sin
reiniciar el agente. Para hacerlo, ejecute la nueva
opción de control de tiempo de ejecución userparameter_reload, p.e..:
zabbix_agentd -R userparameter_reloado
zabbix_agent2 -R userparameter_reload
UserParameter es la única opción de configuración del agente que será recargada con este comando.
Soporte PCRE2
Se ha agregado soporte para PCRE2 y los paquetes de instalación de Zabbix para RHEL 7 y posteriores, SLES (todas las versiones), Debian 9 y posteriores, Ubuntu 16.04 y posteriores se han actualizado para usar PCRE2. PCRE todavía es compatible, pero Zabbix solo se puede compilar con una de las bibliotecas PCRE o PCRE2, ambas no se pueden usar al mismo tiempo.
Zabbix obtiene y tiempo de espera del remitente de Zabbix
Las utilidades Zabbix get y Zabbix sender ahora admiten -t <segundos> o
--timeout <segundos> parámetro de tiempo de espera. El rango válido es:
- 1-30 segundos para la obtención de Zabbix (predeterminado: 30 segundos)
- 1-300 segundos para el remitente Zabbix (predeterminado: 60 segundos)
Funcionalidad de puerta de enlace SNMP ampliada
La puerta de enlace SNMP ahora puede proporcionar información sobre los iniciadores en un estado de problema y revelar información del equipo en los detalles del iniciador.
Además, ahora es posible limitar la tasa de capturas SNMP enviadas por la puerta de enlace SNMP.
La lista de OID compatibles se ha ampliado con un nuevo OID .10 para una lista delimitada por comas de nombres de equipo de iniciadores.
Se han agregado nuevos parámetros al archivo de configuración de la puerta de enlace SNMP:
- ProblemBaseOID - OID de la tabla de iniciadores de problemas;
- ProblemMinSeverity - gravedad mínima, los iniciadores con una gravedad menor no se incluirán;
- ProblemHideAck - si se especifica, solo se incluirán los iniciadores con problemas no reconocidos;
- ProblemTagFilter - si se especifica, solo se incluirán los iniciadores con el nombre de etiqueta especificado;
- TrapTimer: si se configura, Zabbix no enviará más de una captura de la mayor gravedad en el período de tiempo determinado.
Para obtener más detalles, consulte Zabbix SNMP Gateway.
Procesamiento independiente para comprobaciones ODBC
El procesamiento de comprobaciones ODBC se ha trasladado de los procesos de sondeo regulares a los procesos de servidor/proxy independientes sondeos ODBC. Este cambio permite limitar la cantidad de conexiones a la base de datos creadas por los procesos de sondeo. Anteriormente, las comprobaciones ODBC las realizaban los sondeos regulares, que también funcionan con métricas del agente Zabbix, comprobaciones SSH, etc.
Se ha agregado un nuevo parámetro de configuración StartODBCPollers a los archivos de configuración del servidor y proxy Zabbix.
Puede utilizar la métrica interna zabbix[process,<type>] para supervisar la carga de sondeos ODBC.
Transferencia de comandos en tiempo de ejecución
Los comandos de tiempo de ejecución del servidor Zabbix y del proxy ahora se envían a través de un socket en lugar de con señales Unix. Este cambio permite mejorar la experiencia del usuario trabajando con opciones de control de tiempo de ejecución:
- Los resultados de la ejecución del comando ahora se imprimen en la consola.
- Es posible enviar parámetros de entrada más largos, como el nombre del nodo HA en lugar del número de nodo.
Controles de tiempo de ejecución en sistemas operativos basados en BSD
Anteriormente, las opciones de control del tiempo de ejecución del servidor Zabbix y del proxy Zabbix no eran compatibles con los sistemas basados en BSD. El cambio del método de transferencia de comandos en tiempo de ejecución ha permitido eliminar esta limitación. Ahora la mayoría de los comandos son compatibles. en, FreeBSD, NetBSD, OpenBSD y otros sistemas operativos de la familia *BSD.
Para obtener la lista exacta, consulte Control de tiempo de ejecución para el servidor o proxy Zabbix.
Complementos del agente 2 de Zabbix
Archivos de configuración separados
Cada complemento de Zabbix Agent 2 ahora tiene un archivo de configuración separado.
De forma predeterminada, estos archivos se encuentran en el directorio ./zabbix_agent2.d/plugins.d/. La ruta se especifica en el
parámetro Include del archivo de configuración del agente 2 y puede ser relativo a la
ubicación del archivo zabbix_agent2.conf o
zabbix_agent2.win.conf.
Cargador de complementos externo
Anteriormente, los complementos solo se podían compilar en el agente 2 de Zabbix, lo que requería volver a compilar el agente cada vez que fuera necesario para cambiar el conjunto de complementos disponibles. Ahora, con la incorporación del cargador de complementos externo, los complementos no tienen que ser integrados en el agente 2 directamente y se puede agregar como complementos externos separados (complementos cargables), lo que hace que el proceso de creación de complementos adicionales pueda recopilar nuevas métricas de monitoreo más fácilmente.
La introducción de complementos cargables provocó los siguientes cambios en los parámetros de configuración:
- El parámetro Plugins.<PluginName>.Path se ha movido a Plugins.<PluginName>.System.Path.
- El parámetro Plugins.<PluginName>.Capacity, aunque todavía es compatible, ha quedado obsoleto, utilíce Plugins.<Nombre del complemento>.System.Capacity en su lugar.
Plantillas
Nuevas plantillas oficiales están disponibles para el seguimiento.
Kubernetes
- Nodos de Kubernetes por HTTP
- Estado del clúster de Kubernetes por HTTP
- Servidor API de Kubernetes por HTTP
- Administrador del controlador Kubernetes por HTTP
- Programador de Kubernetes por HTTP
- Kubernetes kubelet por HTTP
Para habilitar el monitoreo de Kubernetes, debe usar la nueva herramienta Zabbix Helm Chart, que instala el proxy Zabbix y los agentes Zabbix en el clúster de Kubernetes.
Para obtener más información sobre la configuración de plantillas, consulte Operación de plantilla HTTP.
Microtik
- MikroTik <modelo de dispositivo> SNMP - 53 nuevas plantillas específicas de modelo para monitorear varios modelos de enrutadores y conmutadores ethernet de MikroTik, consulte la lista completa;
- Mikrotik SNMP: una plantilla genérica para monitorear dispositivos MikroTik.
Puede conseguir estas plantillas:
- En Configuración → Plantillas en nuevas instalaciones;
- Al actualizar desde versiones anteriores, se pueden utilizar las plantillas más recientes descargadolas desde el repositorio Git de Zabbix e importadolas manualmente a Zabbix en Configuración → Sección Plantillas. Si ya hay una plantilla con el mismo nombre, marque la opción Eliminar faltante antes de importar para lograr una importación limpia. De esta forma las métricas que han sido excluidas de la plantilla actualizada se eliminarán (tenga en cuenta que el historial de las métricas eliminadas se perderá).
Notificaciones
Integraciones de webhooks
Está disponible una nueva integración que permite utilizar el tipo de medio webhook para crear notificaciones de [Problemas de Github] (https://git.zabbix.com/projects/ZBX/repos/zabbix/browse/templates/media/github/README.md) de Zabbix.
Notificación sobre escalamientos cancelados
Al configurar operaciones de acción, ahora es posible cancelar las notificaciones sobre escalamientos cancelados desmarcando la casilla de verificación de la opción correspondiente.
Interfaz
Requisitos de contraseña
Ahora se pueden proporcionar requisitos de complejidad de contraseña personalizados para el método de autenticación interna de Zabbix. Para evitar que los usuarios de Zabbix establezcan contraseñas débiles, es posible imponer las siguientes restricciones:
- Establecer la longitud mínima de la contraseña.
- Requerir que una contraseña contenga una combinación de mayúsculas y letras minúsculas, dígitos y/o caracteres especiales.
- Prohibir el uso de las contraseñas más comunes y fáciles de adivinar.
Registro de auditoría
Registros
El registro de auditoría ahora contiene registros sobre todos los cambios de configuración para todos los objetos de Zabbix, incluidos los cambios que ocurrieron como resultado de la ejecución de una regla LLD, una acción de descubrimiento de red, una acción de registro automático o la ejecución de un script. Anteriormente, los cambios de configuración iniciados desde el servidor Zabbix, por ejemplo, como resultado de la ejecución de una regla de descubrimiento, no fueron registrados. Ahora dichas modificaciones de objetos se almacenarán como registros de auditoría atribuidos al usuario System.
Filtro de registro
Se agregó una funcionalidad para filtrar registros por la operación de interfaz que causó estas entradas. Si varios registros se han creado como resultado de una única operación, por ejemplo, vincular/desvincular una plantilla, esos registros tendrán el mismo ID del conjunto de registros.
Configuración de auditoría
La nueva sección Registro de auditoría se ha agregado al menú Administración→General, lo que permite habilitar o deshabilitar el registro de auditoría. La configuración de limpieza para auditoría, anteriormente ubicada en la sección Asistente de limpieza, también se ha movido a la nueva Sección Registro de auditoría.
La vinculación de plantillas es más visible
Para que la vinculación de plantillas sea más visible, ahora se coloca en la primera pestaña de los formularios de configuración de equipo, prototipo de equipo y plantilla y en los formularios de actualización masiva de equipo/plantilla.

En consecuencia, se ha eliminado una pestaña independiente para la vinculación de plantillas de todos los formularios respectivos.
En un desarrollo relacionado, en la configuración del prototipo de equipo, los campos para la selección de grupo de equipo/prototipo de grupo de equipo también se han movido de una pestaña independiente a la primera pestaña.
Subfiltro en los datos más recientes
Se ha añadido un subfiltro en la sección Datos más recientes. El subfiltro es útil para acceder rápidamente con un solo clic a grupos de métricas relacionadas.
El subfiltro muestra enlaces en los que se puede hacer clic que permiten filtrar métricas en función de una entidad común: el equipo, el nombre de la etiqueta o el valor de la etiqueta. En cuanto se hace clic en la entidad, las métricas se filtran inmediatamente.
Para obtener más detalles, consulte la sección datos más recientes.
Mejoras de usabilidad para gráficos personalizados
La página de gráficos en Monitoreo → Equipos → Gráficos ha experimentado varias mejoras de usabilidad:
- Ya no hay un límite de 20 gráficos en la página
- Se ha agregado un subfiltro que permite seleccionar rápidamente grupos de gráficos relacionados en función de una etiqueta común o un valor de etiqueta
- Se pueden mostrar gráficos simples para el host junto con gráficos personalizados
Para obtener más detalles, consulte la página gráfico.
Creación de equipos desde Monitoreo
Ahora también es posible crear nuevos equipos desde Monitoreo → Equipos.

El botón Crear equipo está disponible para usuarios administradores y superadministradores.
Edición de equipo como ventana emergente
El formulario para la creación y edición de un equipo ahora se abre en una ventana modal (ventana emergente), en Configuración → Equipos, Monitoreo → Equipos y en cualquier página donde haya un menú de equipo u otro enlace directo a la configuración del equipo.
Los enlaces directos a la página de edición de equipo aún funcionan y abren la página de edición de equipo en página completa.
Mejor navegación entre la configuración de métricas y los datos más recientes
Se ha introducido un nuevo menú contextual para métricas en Últimos datos que permite acceder a la configuración de métricas y a los gráficos disponibles:

Por el contrario, se ha introducido un nuevo menú contextual en la lista de métricas del menú de configuración que permite acceder a los datos más recientes de la métrica y a otras opciones útiles:

Este menú reemplaza la opción del asistente en versiones anteriores. También se ha introducido un menú similar para las métricas de plantilla y los prototipos de métricas.
Monitoreo → Últimos datos actualizados
Se han realizado varias mejoras en la sección Últimos datos:
- Ahora se muestra el tiempo transcurrido desde la última verificación (por ejemplo, 1m 20s) en lugar del tiempo de ejecución de la última métrica.
- Al pasar el cursor sobre el último valor de una métrica, se mostrará el valor sin procesar sin unidades ni asignación de valores aplicada.
- Si un equipo está en mantenimiento, se verá un ícono de llave inglesa naranja junto al nombre del equipo.
Se eliminó la sección Visión general de Monitoreo →
Se eliminó por completo la sección Visión general del menú Visión general.
Se puede seguir accediendo a la misma funcionalidad usando los
widgets de tablero Visión general
de
datos y Visión general de iniciadores.
.
Varios
-
Se ha aumentado el tamaño máximo de los campos siguientes:
-
Parámetros de Preprocesamiento de métricas
-
Mensaje de Tipo de medio
-
El idioma predeterminado de la interfaz web de Zabbix ha cambiado de inglés británico a inglés estadounidense. Se ha eliminado la compatibilidad con inglés británico.
-
El enlace Compartir en el menú principal ha sido reemplazado por un enlace Integraciones que lleva a la página Integraciones en el sitio web de Zabbix.
-
Si la interfaz web de Zabbix se abre en uno de los idiomas disponibles en el sitio web de Zabbix, al hacer clic en el enlace Integraciones se abrirá la página Integraciones en el idioma correspondiente. Para todos los demás idiomas, incluido el inglés, la página Integraciones se abrirá en inglés.
-
Una expresión personalizada, utilizada en configuración de acciones para calcular condiciones, ahora puede tener hasta 1024 caracteres (antes 255).
-
La sección Monitoreo->Equipos ahora muestra un enlace a la pantalla de problemas del equipo incluso si no hay problemas abiertos actualmente.
Cambios importantes
Registro de auditoría
Para implementar los cambios en la funcionalidad del registro de auditoría, se tuvo que volver a trabajar la estructura de la base de datos existente anteriormente. Durante la actualización, las tablas de la base de datos auditlog y auditlog_details se reemplazarán por la nueva tabla
auditlog con un formato diferente. Los registros de registro de auditoría existentes se eliminarán.
Comprobación de versiones de bases de datos compatibles
El servidor y proxy de Zabbix comprobarán ahora la versión de la base de datos antes del lanzamiento y no se iniciarán si la versión está fuera del rango compatible. Para obtener más detalles, consulte bases de datos.
Soporte PCRE2
Zabbix ahora es compatible con PCRE y PCRE2. Los paquetes Zabbix para RHEL 7 y posteriores, SLES (todas las versiones), Debian 9 y las versiones más recientes, Ubuntu 16.04 y las versiones más recientes se han actualizado para compilar con PCRE2 en lugar de PCRE. Al compilar a partir de fuentes, los usuarios pueden elegir especificar el indicador ''--with-libpcre'' o ''--with-libpcre2''. Si está actualizando una instalación existente, cambiar PCRE a PCRE2 puede provocar que algunas expresiones regulares se comporten de manera diferente; consulte los problemas conocidos para obtener más detalles.