Table of Contents
- 5 What's new in Zabbix 3.4.0
- 1 New dashboards
- 2 Templates for network devices
- 3 Remote command support through proxies
- 4 Bulk metrics and dependent items
- 5 Parallel processing of alerts
- 6 Improved notifications
- 7 Item value preprocessing
- 8 Configurable JMX endpoints
- 9 JMX low-level discovery
- 10 PCRE library for regular expressions
- 11 URL-encoding support in web monitoring
- 12 Map improvements
- 13 Support of macros and time suffixes in time periods
- 14 Host macro support in event tags
- 15 Frontend improvements
- 16 Daemon improvements
- 17 Item changes/improvements
- 18 Macro changes
- 19 Low-level discovery
- 20 Return code check for scripts and commands
- See also
5 What's new in Zabbix 3.4.0
1 New dashboards
Having an overview of all the important information has been taken to a new level with the new Zabbix dashboards. Dashboards now can be several, instead of the one dashboard in previous Zabbix versions.
Each dashboard consists of customizable widgets, the content of which the users themselves can choose. This is accomplished by integrating the best features of what previously was known as Zabbix screens into dashboards. So the new dashboard widgets contain a mix of the widgets that may already be familiar from the previous single dashboard as well as widgets containing the best features of Zabbix screens (such as graphs, simple graphs, maps, trigger overview).
Many elements that previously could be used to build a Zabbix screen can now be placed on the dashboard as a dashboard widget. Widgets can also be given a custom name.
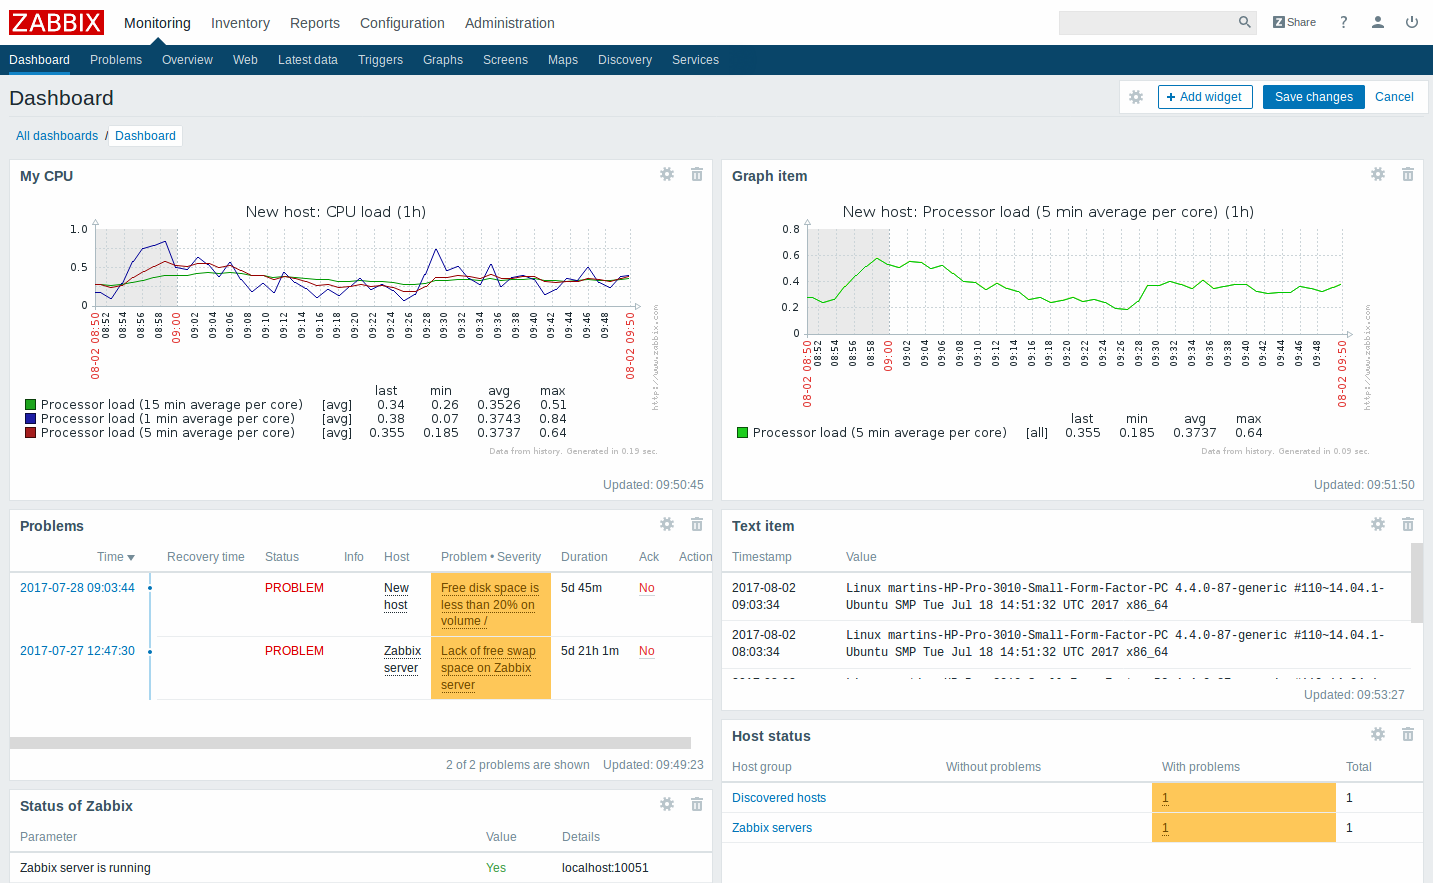
There are also completely new widgets:
- Problems - this widget replaces the Last 20 issues widget from previous versions and displays problems similarly to the Monitoring → Problems section
- Map navigation tree - this widget allows to build a hierarchy of existing maps. See more details.
The dashboard filtering functionality has been removed as a dashboard-wide setting. Instead, the filtering can be applied to individual widgets such as Host status, System status, etc.
New function "Open the action menu"  has been added for modifying and accessing administration settings of a dashboard. It includes "Sharing" option to edit sharing preferences for the dashboard (e.g. share dashboards with other users and provide read only or write permission) as well as Create new, Clone and Display options. See viewing and editing a dashboard and sharing for more information.
For more details, see:
1.1 Map navigation tree
This new widget allows to build a hierarchy of existing maps while also displaying problem statistics with each included map.
It becomes even more powerful if you link the Map widget to the navigation tree. In this case, clicking on a map name in the navigation tree displays the map in full in the Map widget.
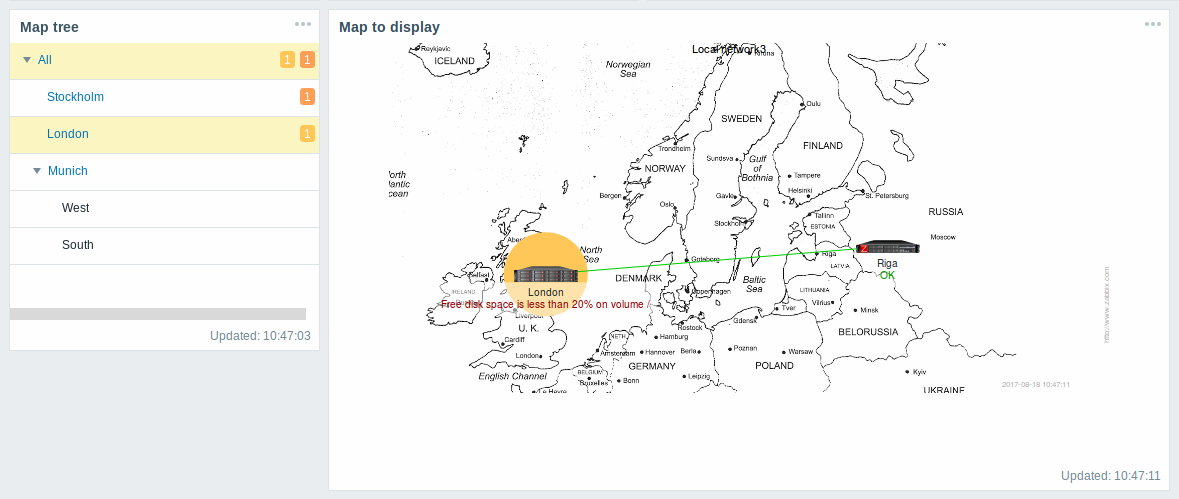
Statistics with the top level map in the hierarchy display a sum of problems of all submaps and its own problems.
2 Templates for network devices
To provide out-of-the-box monitoring for network devices such as switches and routers, new templates have been developed, based mostly on SNMPv2. Templates are provided for many families of network devices. For more information, see:
3 Remote command support through proxies
Remote commands and global scripts previously could not be executed by Zabbix agent if the agent host was monitored by Zabbix proxy. Similarly, commands could not be executed by the proxy itself - the command was always executed by the server.
In Zabbix 3.4, remote commands and global scripts are correctly executed on hosts monitored by proxies. The command is executed by the agent on the target host.
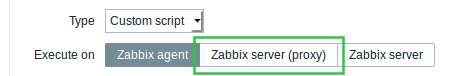
It is also possible to execute a remote command or global script by the proxy itself. This is available as a new option in action operations/global script configuration - execute the command by the server or proxy, depending on whether the host is monitored by server or proxy.
Note that executing remote commands through proxies is disabled by default. In secure environments (encryption, SSH tunneling, etc), remote commands on a proxy can be enabled by setting the EnableRemoteCommands parameter to '1'. IPMI, SSH and Telnet scripts are executed even if remote commands are disabled.
4 Bulk metrics and dependent items
There are situations when one item gathers multiple metrics at a time or it even makes more sense to collect related metrics simultaneously, for example:
- CPU utilization of individual cores
- Incoming/outgoing/total network traffic
To allow for bulk metric collection and simultaneous use in several related items, Zabbix supports dependent items. Dependent items use the master item to collect their data simultaneously, in one query. A new value for the master item automatically populates the values of the dependent items.
Zabbix preprocessing options can be used to extract the part that is needed for the dependent item from the master item data.
See also: Dependent items
5 Parallel processing of alerts
A single alerter process was used in the previous versions to send problem notifications. Alerts were sent out one by one and, in large environments with a large number of events happening in close succession, delays with alerts could occur. Similarly, delays could occur in a mix of slow media types with fast ones (like SMS and e-mail) with the email waiting for the SMS to be sent.
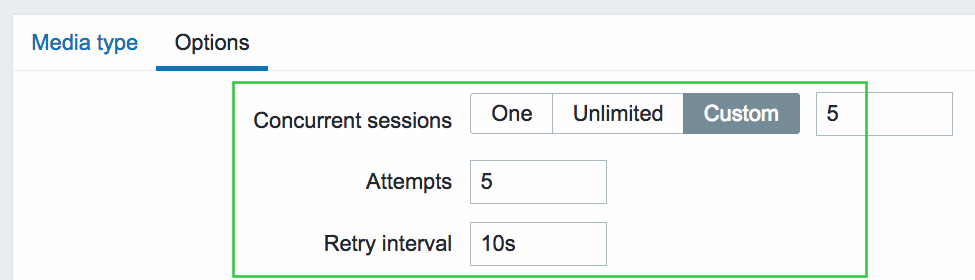
In the new version, parallel processing of alerts is implemented. There is a new alert manager process that can distribute alerts to several "worker" processes, if needed. Media types are processed in parallel. The maximum number of concurrent sessions is configurable per media type, but the total number of alerter processes on server can only be limited by the new StartAlerters parameter. Alerts generated by one trigger are processed sequentially.
There are other related changes:
- Three new alert processing options available in the media type configuration: Concurrent sessions, Attempts and Retry interval:
- Functionality of the database watchdog process has been merged into the alert manager and the watchdog process itself removed.
6 Improved notifications
6.1 Notification on problem acknowledgement
Now it is possible to receive a notification in all the ways available in Zabbix when a trigger-generated problem has been acknowledged. To accomplish this a new type of operation has been set up called acknowledgement operation with its own dedicated tab in action configuration.
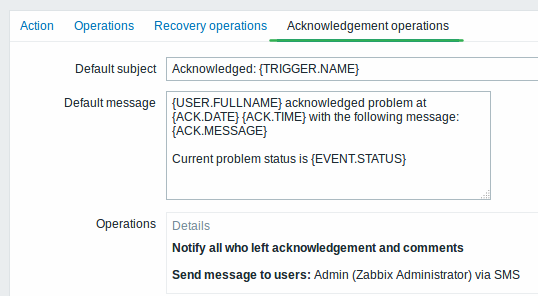
Information that can be included in the acknowledgement notification includes the user and the text entered by the user as acknowledgement. Acknowledgement notifications can be sent to specified users/user groups and/or all the users who have acknowledged the problem and have left comments with it.
Remote commands can also be executed upon problem acknowledgement.
See also:
6.2 Improved default messages
Default messages have been improved to provide more useful information:
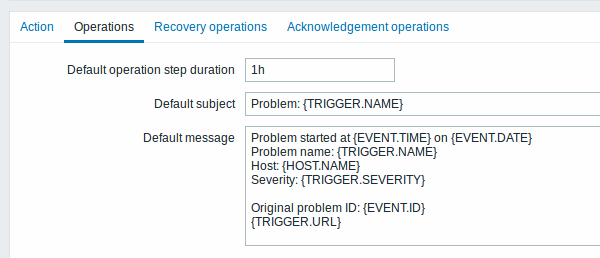
- {TRIGGER.STATUS} macro has been removed, because it no longer can be relied upon if event correlation is used - a problem may be resolved with correlation, while the trigger may still show a problem (changed {EVENT.VALUE} and {EVENT.STATUS} macros can be used instead)
- Host is indicated using the {HOST.NAME} macro
- Problem notifications have been made more distinct from recovery notifications in the message subject
7 Item value preprocessing
When it comes to preprocessing item values before storing them in the database, Zabbix already had several options such as calculating delta value, using a custom multiplier, converting the value type or trimming long text values. These options existed as separate properties in item configuration or were hard-coded.
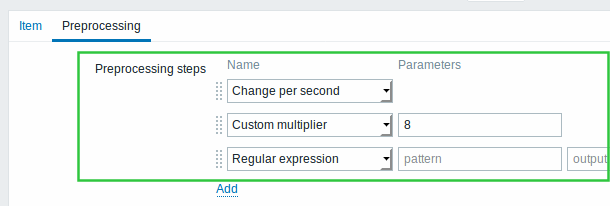
In the new version, all item value preprocessing is brought together and put in the hands of the user under a new Preprocessing tab in item configuration.
7.1 New preprocessing options
Several new options for value preprocessing have been added:
- Regular expression - find match by a regular expression/output template;
- XML XPath - extract value or fragment from XML data using XPath;
- JSON Path - extract value or fragment from JSON data using JSONPath (only a limited set of JSONPath features is supported).
Additionally Delta (simple change) and Delta (speed per second) options have been renamed to Simple change and Change per second.
For a full list of item value preprocessing options and more details, see Item configuration.
8 Configurable JMX endpoints
Previously, a JMX endpoint was hardcoded in Zabbix, which was limiting given that there are applications out there that use different endpoints. To lift this limitation, support for configurable JMX endpoints has been added as a separate field in JMX item configuration. When you open a JMX item, initially the field is filled with the default endpoint, however, that can be freely modified.
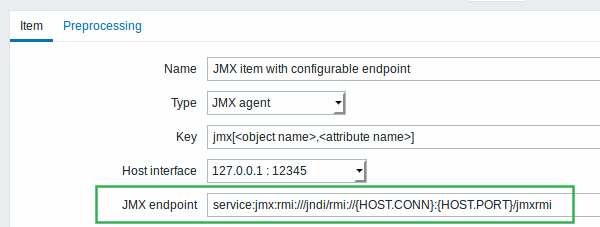
{HOST.*} macros, user macros and low-level discovery macros are supported in the JMX endpoint field.
9 JMX low-level discovery
Low-level discovery of JMX objects is now supported by the new jmx.discovery[<discovery mode>,<object name>] item. This item allows to specify whether to discover MBeans or MBean attributes, as well as the pattern to look for. For more details, see the JMX discovery section.
10 PCRE library for regular expressions
Regular expression support in Zabbix has been switched from POSIX extended regular expressions to Perl Compatible Regular Expressions (PCRE) for enhanced regular expressions and consistency with the frontend.
When upgrading from previous versions, make sure to read the corresponding upgrade notes!
11 URL-encoding support in web monitoring
Previously variable values in web monitoring were passed to the scenario steps unchanged. Any URL-encoding of the values could only be accomplished manually.
11.1 Automatic URL-encoding
GET and POST variable values entered in web scenario steps are now automatically URL-encoded. Encoding is applied no matter what type of data is used (text, macro, scenario-level variable or any combination of those). Encoding is performed before executing the step (data is saved unencoded in the database).
11.2 Flexible URL-encoding for variables
Values of scenario or step-level variables (macros) can be flexibly URL-encoded/decoded, depending on the chosen post variable settings in web scenario steps. For example:
| Version | Variable syntax | Result |
|---|---|---|
| Before 3.4 | {user} | Variable value is passed as is. |
| In 3.4 | {user} {user} {{user}.urlencode()} {{user}.urldecode()} |
Variable value is automatically URL-encoded in Form mode for post variables. Variable value is passed as is in Raw mode for post variables. Variable value is manually URL-encoded in Raw mode for post variables. Variable value is manually URL-decoded in Raw mode for post variables. |
11.3 Unicode support in domain names
Specifying domain names in Unicode characters is now supported in web scenario steps. Unicode characters are automatically punycode-converted to ASCII when executing a web scenario step.
For more details, see web monitoring steps.
12 Map improvements
Graphics in network maps have been moved from bitmap to SVG vector graphics.
Other improvements in maps include:
- Permission changes
- Multiple trigger support
- Drag-and-drop support for multiple elements
- Copy-and-paste support for multiple elements
- Ability to add shapes and lines
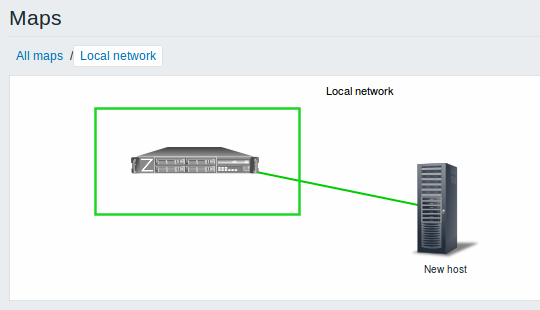
12.1 Permission changes
Maps are no longer hidden if the user does not have read permission to all map elements. Instead, the map is shown, providing the user has read access to at least one element. The elements that the user does not have read permission to are displayed with a grey icon and without any textual information on it (except for triggers which do have labels).
See also: Network map configuration
12.2 Multiple trigger support
When creating a trigger-type map element, it is now possible to select multiple triggers for this element instead of one as before.
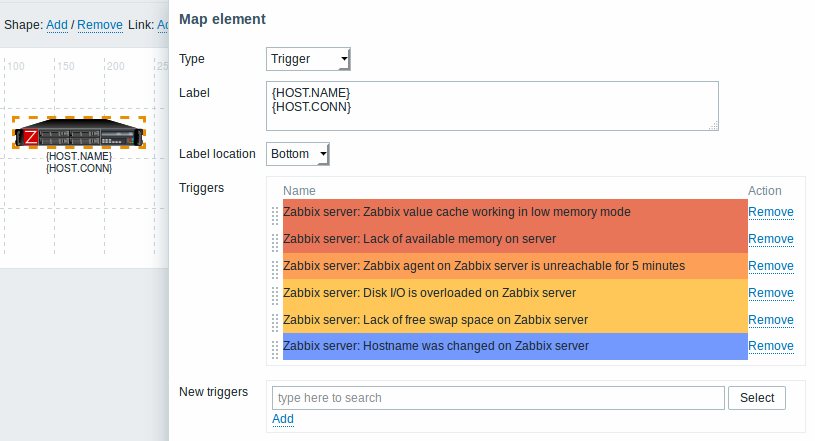
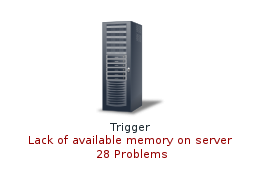
Additionally, the Expand single problem setting in map properties has been reworked into a three-way choice. The new option here is called Number of problems and expand the most critical one. This option is related to the multiple trigger support. If selecting this option, the most critical problem (highest severity trigger) will be displayed by its name on a map element, while the total number of problems will be displayed in another line.
See also: Network map configuration
12.3 Moving elements
Drag-and-drop support has been introduced to map elements. Several selected elements can be moved to another place in the map by clicking on one of the selected elements, holding down the mouse button and moving the cursor to the desired location.
12.4 Copying and pasting elements
Map elements, when selected, can now be copied and pasted within the same map:
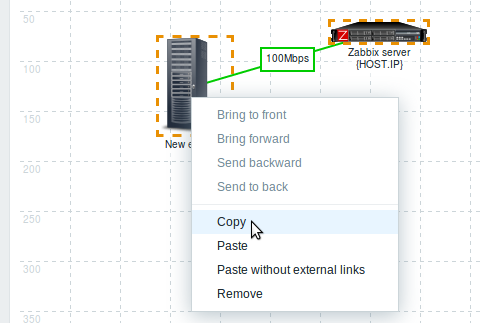
Several selected elements can now also be dragged and dropped in another place all together.
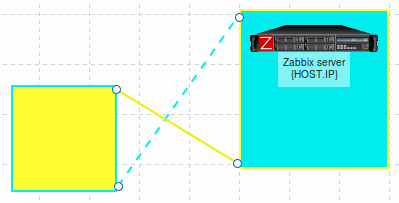
12.5 Adding shapes and lines
Rectangle and ellipse shapes can now be added in network maps. These shapes are a visual representation. For example, a rectangle shape can be used as a background to group some hosts. Shapes are not map elements and cannot be linked. Text can be added in the shapes.
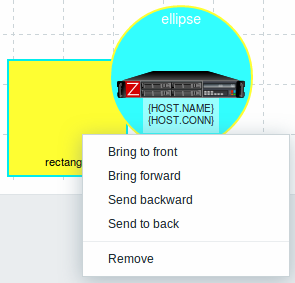
Free-draw lines are another element that can now be added now to a network map.
13 Support of macros and time suffixes in time periods
User macros and time suffixes (such as 30s, 5m, 2h, 1d, 1w) are now supported in item update intervals and many more locations where time periods are specified in Zabbix. It's important to note that in some time periods only user macro support has been added, while in some - only suffix support. For a full list of supported locations see:
User macros can be very useful for fast configuration changes. For example, a user macro may be defined for the item update interval. Then, if you need to change the item polling frequency, you can just change the value of the user macro and the item update interval will be changed in all the items where the macro is used.
Additionally, low-level discovery macros are now supported in item prototype update interval and history/trend storage period fields.
In a related development, some upper/lower limits in time periods have been changed. Importantly, the History storage period for items can now be as short as 1 hour.
14 Host macro support in event tags
Host macros - {HOST.HOST<1-9>}, {HOST.NAME<1-9>}, {HOST.CONN<1-9>}, {HOST.DNS<1-9>}, {HOST.IP<1-9>}, {HOST.PORT<1-9>}, {HOST.ID<1-9>} are now supported in event tag names and values, making it easier to specify host-related tags on template level or to globally correlate events to their hosts.
15 Frontend improvements
15.1 Dropping IE9 and IE10 support
Support for Microsoft Internet Explorer 9 and Explorer 10 will not be provided any more.
15.2 Full cloning of screens and maps
Simple and template screens, along with network maps, can now be fully cloned meaning that not only the layout, but all included screen/map elements are cloned.
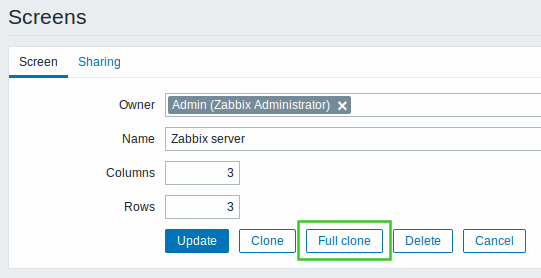
To fully clone a screen, click on the Full clone button, which will temporarily save the screenid, then give the screen a different name and click on the Add button that will create a new screen with all screen elements that fit in the screen layout.
15.3 Unified style for radio buttons and checkboxes
The style for radio buttons and checkboxes has been unified across different browsers.
|<| |<| |-| |<|
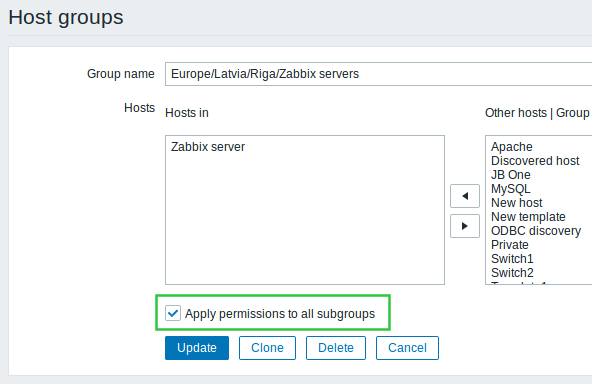
15.4 Applying same permissions to nested host groups
There is a new option in host group configuration that allows to set the level of permissions of the parent host group to all nested host groups. If you mark this checkbox and update the host group, for user groups that may have had differing permissions assigned to nested host groups the permission level of the parent group will be enforced on the nested groups. This is a one-time option and it is not saved in the database. It is available to Zabbix Super Admin users only and only when editing an existing host group.
15.5 Increased field sizes
- SNMP OID field has been increased from 255 to 512 bytes in item, item filter, low-level discovery rule and network discovery rule configuration.
- The flexible interval Period field has been increased from 255 to 1024 bytes in item configuration.
- The user media When active field has been increased from 100 to 1024 bytes.
15.6 Miscellaneous
- It is now possible to hide SQL errors from non-Super Admin users. For more details, see ZBX_SHOW_SQL_ERRORS in Zabbix frontend definitions.
16 Daemon improvements
- SNMP OID length limitation has been increased from 255 to 512 bytes.
- SNMP trapper file size limit that Zabbix can read has been increased from 2^31 (2 GiB) to 2^63 (8 EiB).
- Added support for AtomicBoolean, AtomicInteger, and AtomicLong types to Java gateway.
- Server-proxy data exchange protocol was optimized to reduce the number of connections made to send historical (host availability, item history, discovery and auto registration) data from proxy to server. However server will also accept historical data from 3.2 (and older) proxies, keeping partial backwards compatibility.
- The default data storage period for internal, discovery and agent auto-registration events has been decreased from 365 days to 1 day.
- Maximum error message length has been increased from 128 to 2048 symbols for trigger and alert errors. This should reduce the possibility of error message being trimmed. Error messages can be viewed in Configuration → Hosts → Triggers for triggers and in Reports → Action log for alerts, when rolling the mouse over the error icon.
- Semaphore and shared memory management has been reworked to eliminate the possibility of IPC-related conflicts in between Zabbix daemons and between Zabbix and other applications.
- Cache locking time during configuration synchronization has been reduced.
- To allow internal checks to be processed prior to other items, internal check items are now enqueued at the beginning of the preprocessing queue.
16.1 IPMI polling
Previously one BMC controller could be queried by different processes. To improve the polling speed every IPMI poller kept a connection cache. With a large number of IPMI pollers this could easily overloaded BMC controllers.
Since Zabbix 3.4, a new IPMI manager process has been added to schedule IPMI checks by IPMI pollers. Now a host is always polled by the same IPMI poller, reducing the number of open connections to BMC controllers. With those changes it's safe to increase the number of IPMI pollers without worrying about BMC controller overloading. The IPMI manager process is automatically started when at least one IPMI poller is started.
16.2 Preprocessing manager
A new preprocessing manager process has been added along with workers that perform the preprocessing steps. All values (with or without preprocessing) from different data gatherers pass through the preprocessing manager before being added to the history cache. Socket-based IPC communication is introduced between data gatherers (pollers, trappers, etc) and the preprocessing process.
16.3 Configuration parameters
A new StartAlerters configuration parameter has been added to Zabbix server configuration. As parallel processing of alerts is introduced in this version, the 'StartAlerters' parameter determines how many alerter processes are started by Zabbix server.
A SocketDir configuration parameter has been added to Zabbix server and proxy configurations. This parameter points to the directory where internal Zabbix socket files are stored (/tmp by default). Server and proxy uses different socket file names so it's safe to use the same 'SocketDir' for server and proxy running on the same system. However, running multiple servers or proxies in the same system will require different 'SocketDir' configurations.
A StartPreprocessors configuration parameter has been added to Zabbix server configuration. As a preprocessing manager process is introduced in this version, the 'StartPreprocessors' parameter determines how many item value preprocessing workers are started by Zabbix server.
EnableRemoteCommands and LogRemoteCommands parameters have been added to the proxy configuration file, as remote commands are now supported through proxies as well. Both are disabled by default.
While the upper limit of the MaxLinesPerSecond agent parameter remains the same (1000), this limit of new log lines the agent can send per second to Zabbix server is now multiplied by 10 (instead of 4) when it comes to the total amount of lines that can be read by the agent.
16.4 More information on agent metric thread crashes
Previously, in case of a Zabbix agent metric thread crash only a one-line error message was logged. Now additional information including the program counter, register, stack frame (only in the 32-bit version) and a backtrace is provided in the agent log file in this case. In a minor additional improvement the logged return values of executing metric threads have been changed from numeric to string for better readability.
17 Item changes/improvements
A new vfs.dir.size agent item has been added to monitor directory size. This item is supported on UNIX and Windows platforms.
For the proc.num agent item two additional states are supported:
- disk - process in uninterruptible disk sleep (usually I/O)
- trace - process is stopped by job control signal
A new zabbix[host,discovery,interfaces] internal item has been added to return all host interfaces configured in Zabbix frontend. This item can be used in low-level discovery.
A new zabbix[preprocessing_queue] internal item has been added to count the values enqueued in the preprocessing queue.
18 Macro changes
{EVENT.VALUE} and {EVENT.STATUS} macros have been changed and now return (for trigger and internal events):
- 'Problem' value if the original event is still in problem state;
- 'OK' value if the original event has been resolved.
19 Low-level discovery
- Support of LLD macros in the function parameters of trigger prototype expression has been added.
- Support of LLD macros in the function parameters when using function with ITEM.VALUE, ITEM.LASTVALUE in trigger prototype name, description and tags has been added.
- Support of LLD macros in the function parameters of graph prototype name simple macros like {host:key[].func()} has been added.
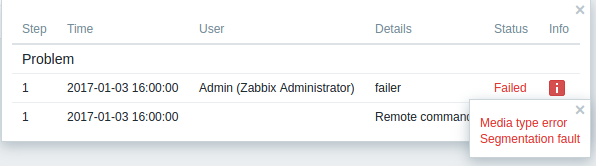
20 Return code check for scripts and commands
Now Zabbix checks exit codes for user parameters, remote commands and system.run[] items without the “nowait” flag as well as Zabbix server executed scripts (alert, external and global). In case of an error in a script or a command execution process Zabbix provides error description in the frontend as well as creates corresponding log entries.