Ad Widget

Collapse

Zabbix Server is not Running.

Collapse
X
 
  • Time
  • Show
Clear All
new posts
  • kristiaan_d
    Junior Member
    • May 2009
    • 15

    #1

    Zabbix Server is not Running.

    Hi Everyone,
    I'd appreciate some help if possible as I'm slowly loosing the will to live

    I posted recently about getting Zabbix up and running, due to a fault of my own the Virtual Machine was lost and I've had to start again, however this time rather than using Zabbix 1.8 I have opted to use version 2.2

    i keep getting this error message.


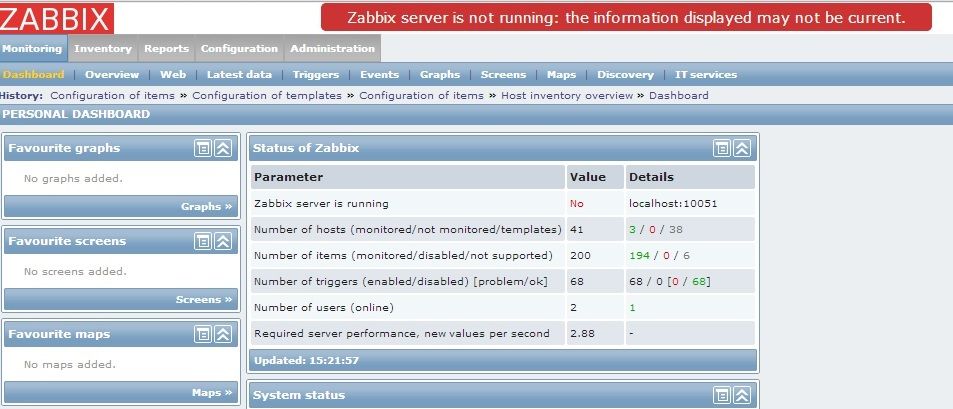
    I've found LOADS of threads on this forum about this problem and links to other sites but so far nothing i have changed or tried has made any difference.

    I am running Zabbix 2.2.5, the server, GUI & database are all running from the same machine and i have switched on the Local agent to monitor the server and this is where the error is coming from.

    The Server is a Centos 6.5 64Bit Minimal installation that has nothing else installed.

    I dont know if this is a config file issue or a server problem at the moment but its the only constant warning i am getting.

    the Tail of zabbix_server.log & Agent are below.

    zabbix_server.log
    Code:
     zabbix]# tail /var/log/zabbix/zabbix_server.log
     22877:20140806:143419.701 server #26 started [self-monitoring #1]
     22843:20140806:143419.897 server #6 started [poller #4]
     22844:20140806:143419.901 server #7 started [poller #5]
     22842:20140806:143419.910 server #5 started [poller #3]
     22841:20140806:143419.913 server #4 started [poller #2]
     22845:20140806:143419.917 server #8 started [unreachable poller #1]
     22839:20140806:143419.919 server #3 started [poller #1]
     22864:20140806:143419.945 server #19 started [discoverer #1]
     22859:20140806:153419.624 executing housekeeper
     22859:20140806:153419.629 housekeeper [deleted 0 hist/trends, 0 items, 0 events, 0 sessions, 0 alarms, 0 audit items in 0.003542 sec, idle 1 hour(s)]
    [root@odo zabbix]#
    zabbix_agent.log
    Code:
     zabbix]# tail /var/log/zabbix/zabbix_agentd.log
     22596:20140806:141724.027 Starting Zabbix Agent [Zabbix server]. Zabbix 2.2.5 (revision 47411).
     22596:20140806:141724.032 using configuration file: /etc/zabbix/zabbix_agentd.conf
     22597:20140806:141724.042 agent #0 started [collector]
     22598:20140806:141724.048 agent #1 started[listener #1]
     22599:20140806:141724.050 agent #2 started[listener #2]
     22600:20140806:141724.051 agent #3 started[listener #3]
     22601:20140806:141724.052 agent #4 started [active checks #1]
    [root@odo zabbix]#
  • tchjts1
    Senior Member
    • May 2008
    • 1605

    #2
    What does ps -ef|grep zabbix show you?

    Comment

    • kristiaan_d
      Junior Member
      • May 2009
      • 15

      #3
      Originally posted by tchjts1
      What does ps -ef|grep zabbix show you?
      Quite a lot

      Code:
       ps -ef|grep zabbix
      zabbix   22596     1  0 14:17 ?        00:00:00 zabbix_agentd -c /etc/zabbix/zabbix_agentd.conf
      zabbix   22597 22596  0 14:17 ?        00:00:02 zabbix_agentd: collector [idle 1 sec]   
      zabbix   22598 22596  0 14:17 ?        00:00:01 zabbix_agentd: listener #1 [waiting for connection]
      zabbix   22599 22596  0 14:17 ?        00:00:00 zabbix_agentd: listener #2 [waiting for connection]
      zabbix   22600 22596  0 14:17 ?        00:00:00 zabbix_agentd: listener #3 [waiting for connection]
      zabbix   22601 22596  0 14:17 ?        00:00:00 zabbix_agentd: active checks #1 [idle 1 sec]
      zabbix   22833     1  0 14:34 ?        00:00:00 zabbix_server -c /etc/zabbix/zabbix_server.conf
      zabbix   22837 22833  0 14:34 ?        00:00:00 zabbix_server: configuration syncer [synced configuration in 0.012830 sec, idle 60 sec]
      zabbix   22838 22833  0 14:34 ?        00:00:00 zabbix_server: db watchdog [synced alerts config in 0.001223 sec, idle 60 sec]
      zabbix   22839 22833  0 14:34 ?        00:00:03 zabbix_server: poller #1 [got 1 values in 0.001911 sec, idle 1 sec]
      zabbix   22841 22833  0 14:34 ?        00:00:02 zabbix_server: poller #2 [got 2 values in 0.018779 sec, idle 1 sec]
      zabbix   22842 22833  0 14:34 ?        00:00:03 zabbix_server: poller #3 [got 0 values in 0.000005 sec, idle 1 sec]
      zabbix   22843 22833  0 14:34 ?        00:00:03 zabbix_server: poller #4 [got 0 values in 0.000005 sec, idle 1 sec]
      zabbix   22844 22833  0 14:34 ?        00:00:02 zabbix_server: poller #5 [got 0 values in 0.000004 sec, idle 1 sec]
      zabbix   22845 22833  0 14:34 ?        00:00:00 zabbix_server: unreachable poller #1 [got 0 values in 0.000007 sec, idle 5 sec]
      zabbix   22846 22833  0 14:34 ?        00:00:00 zabbix_server: trapper #1 [processed data in 0.000000 sec, waiting for connection]
      zabbix   22848 22833  0 14:34 ?        00:00:00 zabbix_server: trapper #2 [processed data in 0.000000 sec, waiting for connection]
      zabbix   22849 22833  0 14:34 ?        00:00:00 zabbix_server: trapper #3 [processed data in 0.000000 sec, waiting for connection]
      zabbix   22851 22833  0 14:34 ?        00:00:00 zabbix_server: trapper #4 [processed data in 0.000000 sec, waiting for connection]
      zabbix   22854 22833  0 14:34 ?        00:00:00 zabbix_server: trapper #5 [processed data in 0.001369 sec, waiting for connection]
      zabbix   22856 22833  0 14:34 ?        00:00:00 zabbix_server: icmp pinger #1 [got 0 values in 0.000007 sec, idle 5 sec]
      zabbix   22857 22833  0 14:34 ?        00:00:00 zabbix_server: alerter [sent alerts: 0 success, 0 fail in 0.000653 sec, idle 30 sec]
      zabbix   22859 22833  0 14:34 ?        00:00:00 zabbix_server: housekeeper [deleted 0 hist/trends, 0 items, 0 events, 0 sessions, 0 alarms, 0 audit items in 0.003542 sec, idle 1 hour(s)]
      zabbix   22860 22833  0 14:34 ?        00:00:00 zabbix_server: timer #1 [processed 3 triggers, 0 events in 0.000310 sec, 0 maintenances in 0.000000 sec, idle 30 sec]
      zabbix   22863 22833  0 14:34 ?        00:00:00 zabbix_server: http poller #1 [got 0 values in 0.000680 sec, idle 5 sec]
      zabbix   22864 22833  0 14:34 ?        00:00:00 zabbix_server: discoverer #1 [processed 0 rules in 0.000690 sec, idle 60 sec]
      zabbix   22866 22833  0 14:34 ?        00:00:00 zabbix_server: history syncer #1 [synced 0 items in 0.000001 sec, idle 5 sec]
      zabbix   22868 22833  0 14:34 ?        00:00:00 zabbix_server: history syncer #2 [synced 0 items in 0.000001 sec, idle 5 sec]
      zabbix   22870 22833  0 14:34 ?        00:00:00 zabbix_server: history syncer #3 [synced 19 items in 0.003779 sec, idle 5 sec]
      zabbix   22872 22833  0 14:34 ?        00:00:00 zabbix_server: history syncer #4 [synced 0 items in 0.000001 sec, idle 5 sec]
      zabbix   22874 22833  0 14:34 ?        00:00:00 zabbix_server: escalator [processed 0 escalations in 0.000471 sec, idle 3 sec]
      zabbix   22875 22833  0 14:34 ?        00:00:00 zabbix_server: proxy poller #1 [exchanged data with 0 proxies in 0.000004 sec, idle 5 sec]
      zabbix   22877 22833  0 14:34 ?        00:00:00 zabbix_server: self-monitoring [processed data in 0.000007 sec, idle 1 sec]
      root     24361  1148  0 16:21 pts/0    00:00:00 grep zabbix

      Comment

      • tchjts1
        Senior Member
        • May 2008
        • 1605

        #4
        Ok. And instead of doing tail on zabbix_server.log, can you show the very beginning of the start process?

        Comment

        • kristiaan_d
          Junior Member
          • May 2009
          • 15

          #5
          Originally posted by tchjts1
          Ok. And instead of doing tail on zabbix_server.log, can you show the very beginning of the start process?
          I have already restarted the server service once so it may show bits about be restarting it.

          Code:
           20531:20140806:143418.888 syncing history data...
           20531:20140806:143418.924 syncing history data done
           20531:20140806:143418.925 syncing trends data...
           20531:20140806:143418.930 syncing trends data done
           20531:20140806:143418.939 Zabbix Server stopped. Zabbix 2.2.5 (revision 47411).
           22833:20140806:143419.318 Starting Zabbix Server. Zabbix 2.2.5 (revision 47411).
           22833:20140806:143419.318 ****** Enabled features ******
           22833:20140806:143419.318 SNMP monitoring:           YES
           22833:20140806:143419.318 IPMI monitoring:           YES
           22833:20140806:143419.318 WEB monitoring:            YES
           22833:20140806:143419.318 VMware monitoring:         YES
           22833:20140806:143419.318 Jabber notifications:      YES
           22833:20140806:143419.318 Ez Texting notifications:  YES
           22833:20140806:143419.318 ODBC:                      YES
           22833:20140806:143419.318 SSH2 support:              YES
           22833:20140806:143419.318 IPv6 support:              YES
           22833:20140806:143419.318 ******************************
           22833:20140806:143419.319 using configuration file: /etc/zabbix/zabbix_server.conf
           22833:20140806:143419.343 current database version (mandatory/optional): 02020000/02020001
           22833:20140806:143419.343 required mandatory version: 02020000
           22837:20140806:143419.362 server #1 started [configuration syncer #1]
           22838:20140806:143419.366 server #2 started [db watchdog #1]
           22846:20140806:143419.448 server #9 started [trapper #1]
           22848:20140806:143419.461 server #10 started [trapper #2]
           22849:20140806:143419.462 server #11 started [trapper #3]
           22851:20140806:143419.472 server #12 started [trapper #4]
           22854:20140806:143419.488 server #13 started [trapper #5]
           22856:20140806:143419.506 server #14 started [icmp pinger #1]
           22857:20140806:143419.514 server #15 started [alerter #1]
           22859:20140806:143419.523 server #16 started [housekeeper #1]
           22859:20140806:143419.538 executing housekeeper
           22860:20140806:143419.540 server #17 started [timer #1]
           22863:20140806:143419.560 server #18 started [http poller #1]
           22866:20140806:143419.601 server #20 started [history syncer #1]
           22859:20140806:143419.621 housekeeper [deleted 0 hist/trends, 0 items, 0 events, 0 sessions, 0 alarms, 0 audit items in 0.067016 sec, idle 1 hour(s)]
           22868:20140806:143419.622 server #21 started [history syncer #2]
           22870:20140806:143419.642 server #22 started [history syncer #3]
           22872:20140806:143419.657 server #23 started [history syncer #4]
           22874:20140806:143419.683 server #24 started [escalator #1]
           22875:20140806:143419.684 server #25 started [proxy poller #1]
           22833:20140806:143419.695 server #0 started [main process]
           22877:20140806:143419.701 server #26 started [self-monitoring #1]
           22843:20140806:143419.897 server #6 started [poller #4]
           22844:20140806:143419.901 server #7 started [poller #5]
           22842:20140806:143419.910 server #5 started [poller #3]
           22841:20140806:143419.913 server #4 started [poller #2]
           22845:20140806:143419.917 server #8 started [unreachable poller #1]
           22839:20140806:143419.919 server #3 started [poller #1]
           22864:20140806:143419.945 server #19 started [discoverer #1]
           22859:20140806:153419.624 executing housekeeper
           22859:20140806:153419.629 housekeeper [deleted 0 hist/trends, 0 items, 0 events, 0 sessions, 0 alarms, 0 audit items in 0.003542 sec, idle 1 hour(s)]

          Comment

          • tchjts1
            Senior Member
            • May 2008
            • 1605

            #6
            That is odd. My last bit of advice then, is to take a look through your Apache log for any errors, and also verify that the contents of your zabbix.conf.php file are correct.

            Comment

            • rogerlawrence
              Junior Member
              • Aug 2014
              • 6

              #7
              Had the same issue earlier...

              Sure no SQL errors in your Zabbix log? Make sure that the DB password is set in your zabbix_server.conf

              Running 2.2.5 with CentOS6.5 /min install as well. MySQL 5.5...

              Comment

              • tchjts1
                Senior Member
                • May 2008
                • 1605

                #8
                Originally posted by rogerlawrence
                Sure no SQL errors in your Zabbix log? Make sure that the DB password is set in your zabbix_server.conf

                Running 2.2.5 with CentOS6.5 /min install as well. MySQL 5.5...
                That was my thought as well, and why I had him show the beginning of the start process of the zabbix_server.log. I would think a DB connection error would show there. But... worth double checking in the file itself.

                Comment

                • jan.garaj
                  Senior Member
                  Zabbix Certified Specialist
                  • Jan 2010
                  • 506

                  #9
                  Your frontend is checking zabbix_server on localhost:10051. So make sure that it listen there (netstat -tanp | grep 10051).
                  The best setting in this case is:
                  Code:
                  ListenIP=0.0.0.0
                  So server will listen on all network interfaces (localhost included)

                  If your server listens on localhost, then check (disable) selinux.
                  Devops Monitoring Expert advice: Dockerize/automate/monitor all the things.
                  My DevOps stack: Docker / Kubernetes / Mesos / ECS / Terraform / Elasticsearch / Zabbix / Grafana / Puppet / Ansible / Vagrant

                  Comment

                  • kristiaan_d
                    Junior Member
                    • May 2009
                    • 15

                    #10
                    Originally posted by jan.garaj
                    Your frontend is checking zabbix_server on localhost:10051. So make sure that it listen there (netstat -tanp | grep 10051).
                    The best setting in this case is:
                    Code:
                    ListenIP=0.0.0.0
                    So server will listen on all network interfaces (localhost included)

                    If your server listens on localhost, then check (disable) selinux.
                    Hi heres the output for the netstat command.

                    Code:
                    # netstat -tanp | grep 10051
                    tcp        0      0 0.0.0.0:10051               0.0.0.0:*                   LISTEN      22833/zabbix_server
                    tcp        0      0 172.30.150.3:10051          172.30.20.12:61033          TIME_WAIT   -
                    tcp        0      0 :::10051                    :::*                        LISTEN      22833/zabbix_server
                    How do i go about configuring Selinux for Zabbix, i'd rather not disable it unless absolutely needed.

                    Comment

                    • kristiaan_d
                      Junior Member
                      • May 2009
                      • 15

                      #11
                      **fixed**

                      Guys just to make you aware I opted to set SELINUX to permissive and it fixed the issue.


                      I modified
                      Code:
                      /etc/selinux/config
                      and set
                      Code:
                      SELINUX=permissive
                      rebooted the server and the warning went away.

                      thanks for all the suggestions and advice on this.

                      Comment

                      Working...