Ad Widget

Collapse

stacked graphs, with 0 values

Collapse
X
 
  • Time
  • Show
Clear All
new posts
  • Skinkie
    Junior Member
    • Jul 2013
    • 6

    #1

    stacked graphs, with 0 values

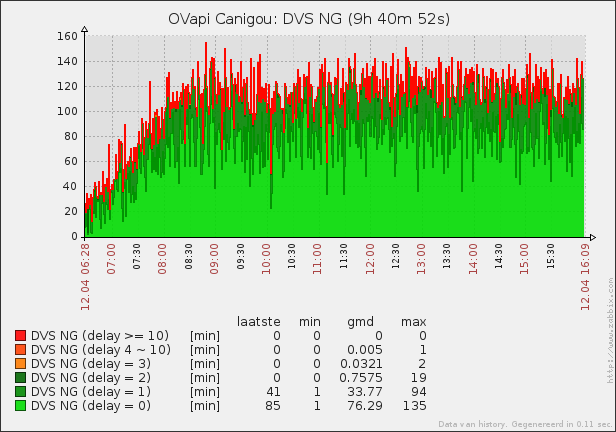
    Currently we have some graphs which have 0 values. Especially when zoomed out it is easy to observed that these attributes are stacked as if per time interval they are at least one. My guess is that this kind of bug must be known somewhere by now.
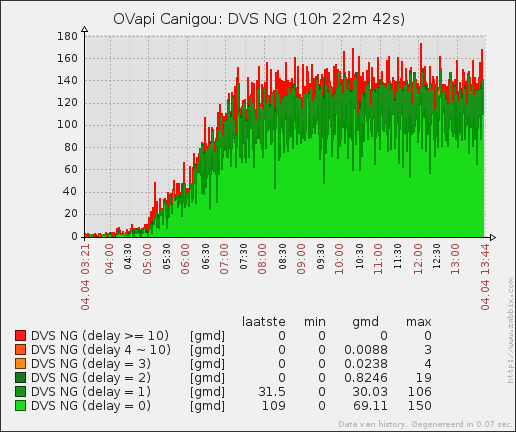


    The red surface is wrong. In general it is added on every timepoint, while it is always 0. And in some valleys it is just plain wrong and looks (integrated) as if there is more output than every recorded.
  • jan.garaj
    Senior Member
    Zabbix Certified Specialist
    • Jan 2010
    • 506

    #2
    It depends how did you configure you graph item. I guess that you are using default avg function. Try to change it to min.

    Code:
    What values will be displayed when more than one value exists for an item:
    all - all (minimum, average and maximum)
    min - minimum only
    avg - average only
    max - maximum only
    Devops Monitoring Expert advice: Dockerize/automate/monitor all the things.
    My DevOps stack: Docker / Kubernetes / Mesos / ECS / Terraform / Elasticsearch / Zabbix / Grafana / Puppet / Ansible / Vagrant

    Comment

    • Skinkie
      Junior Member
      • Jul 2013
      • 6

      #3
      Originally posted by jan.garaj
      It depends how did you configure you graph item. I guess that you are using default avg function. Try to change it to min.
      I have just done so... and while looking promising at first, it is still wrong.

      Comment

      • jan.garaj
        Senior Member
        Zabbix Certified Specialist
        • Jan 2010
        • 506

        #4
        Pls post just one hour graph.
        Devops Monitoring Expert advice: Dockerize/automate/monitor all the things.
        My DevOps stack: Docker / Kubernetes / Mesos / ECS / Terraform / Elasticsearch / Zabbix / Grafana / Puppet / Ansible / Vagrant

        Comment

        • Skinkie
          Junior Member
          • Jul 2013
          • 6

          #5

          Comment

          • jan.garaj
            Senior Member
            Zabbix Certified Specialist
            • Jan 2010
            • 506

            #6
            I see it. IMHO it's standard Zabbix graph visualization (it's a feature :-D)
            You can check/raise a issue https://support.zabbix.com.
            Devops Monitoring Expert advice: Dockerize/automate/monitor all the things.
            My DevOps stack: Docker / Kubernetes / Mesos / ECS / Terraform / Elasticsearch / Zabbix / Grafana / Puppet / Ansible / Vagrant

            Comment

            • Skinkie
              Junior Member
              • Jul 2013
              • 6

              #7
              Very old bug it seems:

              Comment

              Working...