Ad Widget
Collapse
Zabbix 3.2 and Juniper templates
Collapse
X
-
if a graph is not working maybe the item connected to is not supported?Hi,
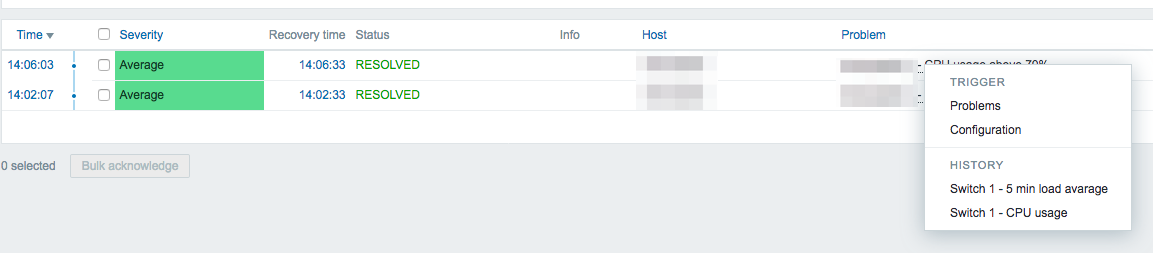
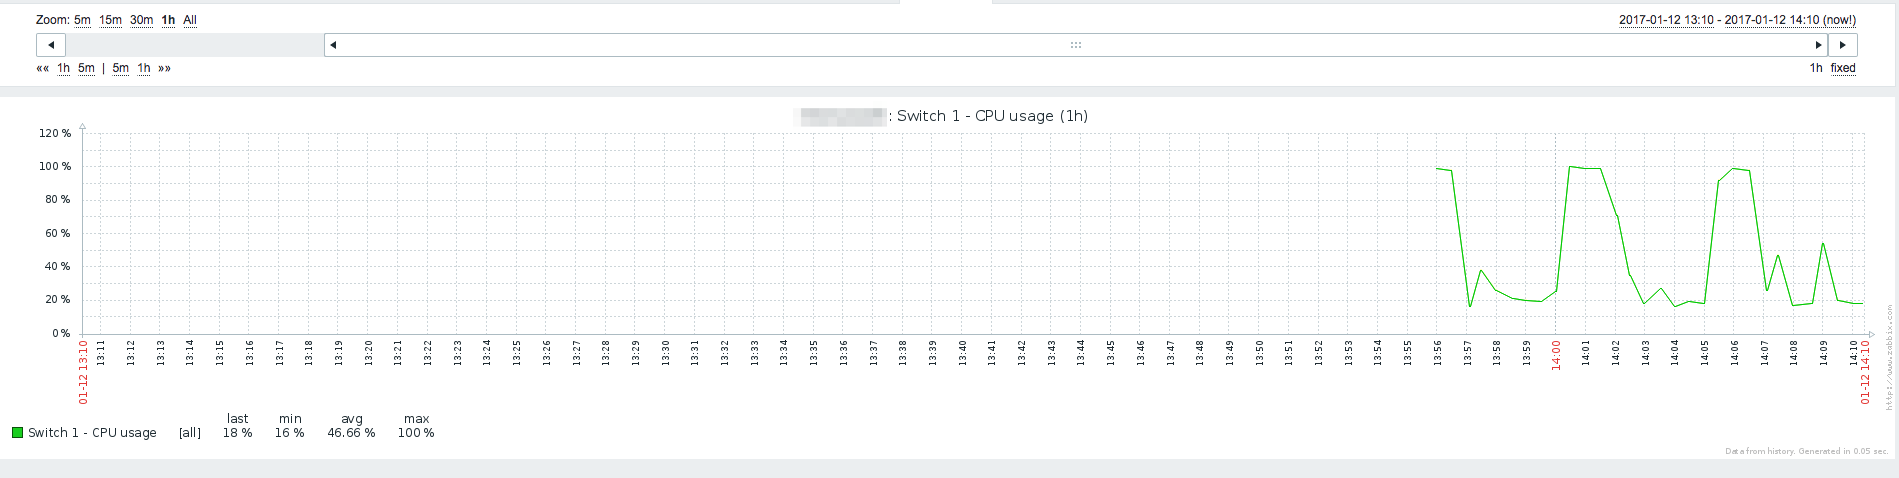
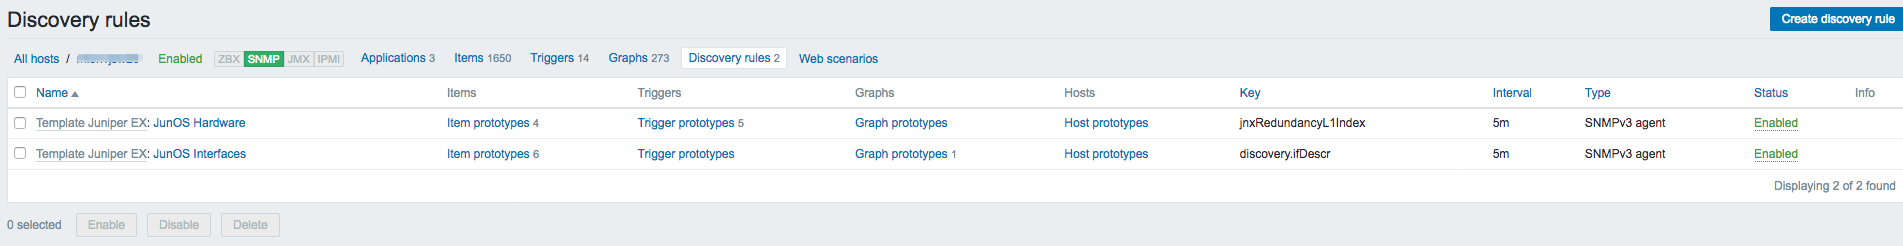
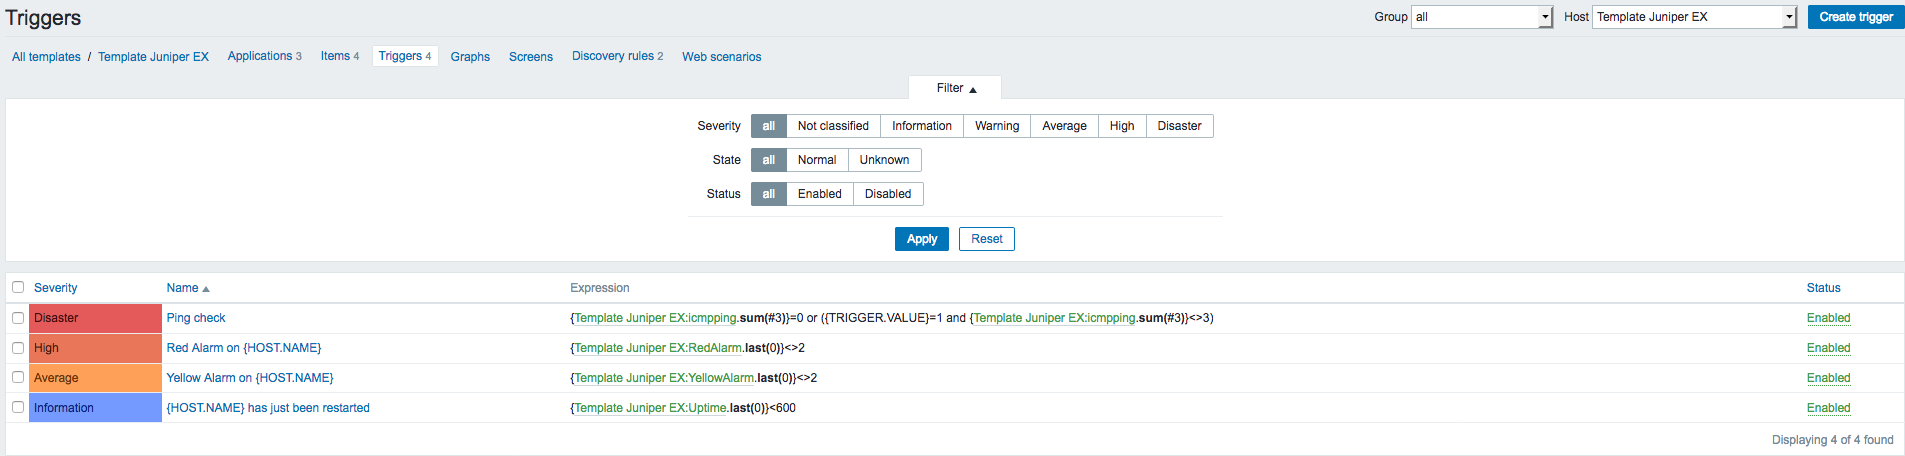
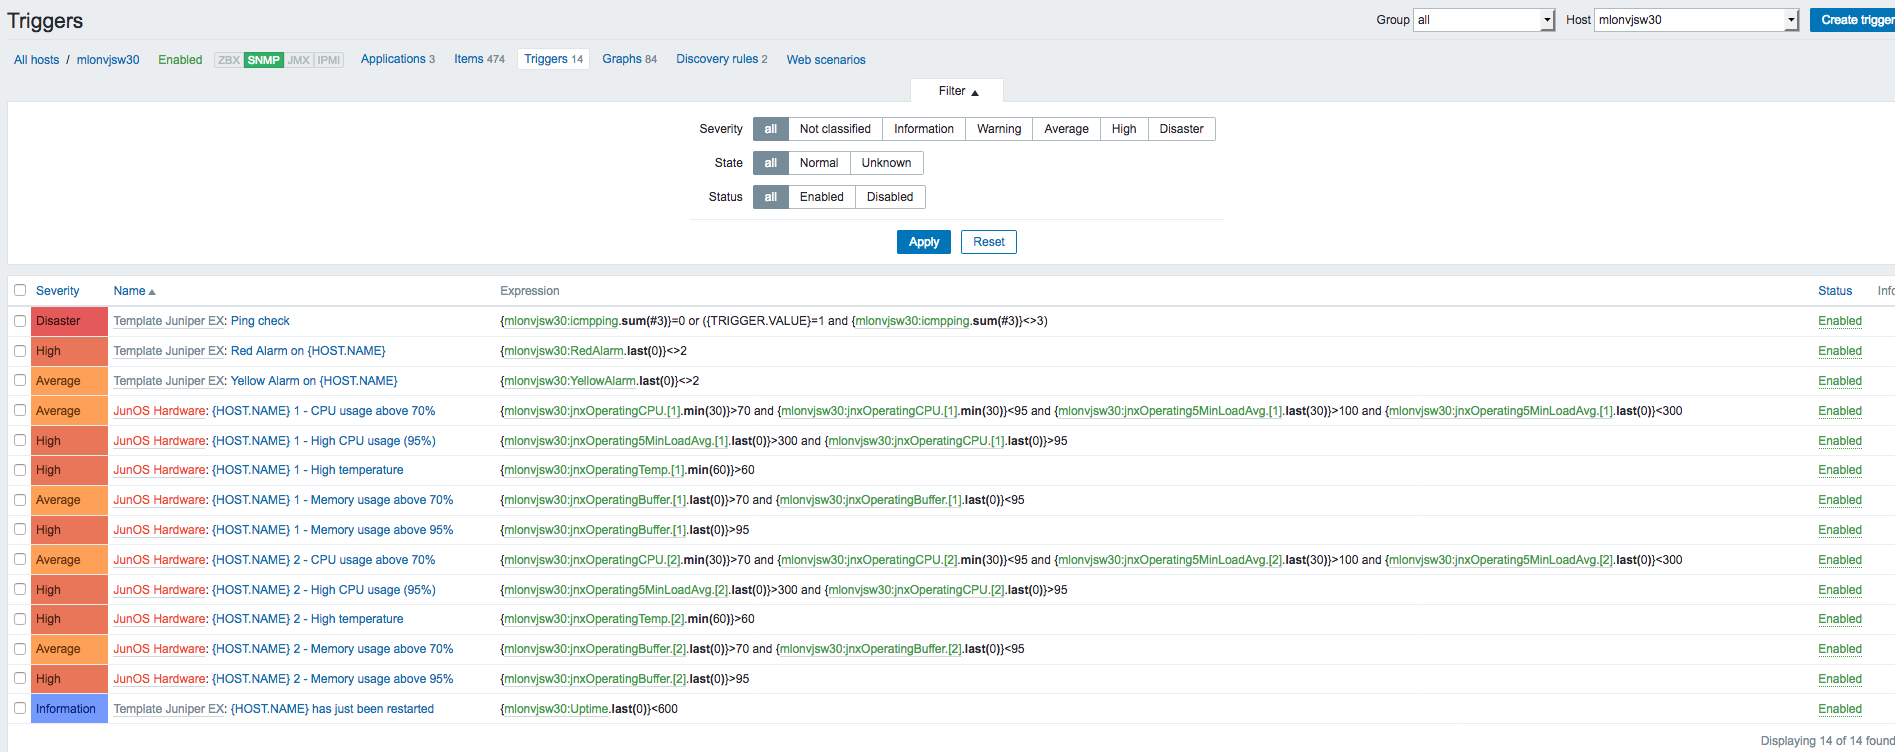
I´m using the latest zabbix 3.2 server and I´m unable to show graphs for Device Health (CPU etc) for Juniper EX switches using this template:
Interface graphs seems to work. These device are being polled with snmpv3
Does anybody has a working Juniper (EX) template and could share it?
Thank you
and i think you can get overall health by connecting the SNMPV3 templates to this device.
if not- you can always use the MIB file of the device and customized it. -
yes,
every device have its MIB file and there is stored this device object to make
checks on this device - after you find it i can help you investigate it .
you can find it either on :
Internet - by model name
ask juniper for it
at the device itself (i know forti have it on the device itself at some tab- search)Comment
-
Thank you for your reply.
Interesting though: one of the EX2200 switches had a short CPU spike. Under -> Monitoring->Triggers I can click on the device and see the history graphs of the CPU utilization but I cannot see the graphs in the drop down field Monitoring->Graphs
So apparently the graphs are working. Any help is much appreciated. Thank youComment
-
you you go to Configuration -> Hosts and see your device click on GraphsThank you for your reply.
Interesting though: one of the EX2200 switches had a short CPU spike. Under -> Monitoring->Triggers I can click on the device and see the history graphs of the CPU utilization but I cannot see the graphs in the drop down field Monitoring->Graphs
So apparently the graphs are working. Any help is much appreciated. Thank you
all the Graphs there should be on the Monitoring - > Graphs menu
if you dont see them maybe a user issue ?
maybe your talking about a different Graphs and thats maybe means you need to set them up ?
i personally dont have Graphs under Monitoring->Triggers i have there my recent Triggers..Comment
-
Yes, but I only see the interface graphs not the device health graphs.you you go to Configuration -> Hosts and see your device click on Graphs
all the Graphs there should be on the Monitoring - > Graphs menu
OK, I think it was the "Problem" page can´t recall. But have a look, maybe you understand what I mean:i personally dont have Graphs under Monitoring->Triggers i have there my recent Triggers..


Last edited by Mechanix; 17-01-2017, 14:32.Comment
-
i cant see your attachments
any ways- if you dont see this graphs at host conf that means that they are not set
but you can set them manually.
just add a graph- choose the item that collect this info and you will have a graphComment
-
ok i saw it - it seems like zabbix is gathring statistics but is not configured as a grafh
you can solve it-
see the trigger you have choose - take its item key for exsample :
if i had this trigger at Monitoring-> Triggers
and it has a grafe i wanted i can see the item key is :Code:Response time is too high on ISCSI {ISCSI:icmppingsec.avg(5m)}>0.15
icmppingsec
then if this trigger is a part of a templet i suggest go to this template
throw : Configuration - > Templates and press on Graphs
there you choose to create a new Graph and choose this item key
icmppingsec
and then you could see this costum Graph at the Monitoring - > Graphs after 5 minComment
-
Thank you. I could manually create the graphs in Configuration > Host->Graphs there I could select the CPU/Memory etc items.!!!! Thanks a lot
On the Template -> Graph page the only items I can select are:
Ping check icmpping Simple check Numeric (unsigned) Enabled
Red alarm RedAlarm SNMPv3 agent Numeric (unsigned) Enabled
Uptime Uptime SNMPv3 agent Numeric (unsigned) Enabled
Yellow alarm YellowAlarm SNMPv3 agent Numeric (unsigned) Enabled
no CPU/Memory/Temperature.
I would prefere to have the creation of the graphs in the template though as we have more then 50 devices.Comment
-
the cpu trigger -is not part of an Template?Thank you. I could manually create the graphs in Configuration > Host->Graphs there I could select the CPU/Memory etc items.!!!! Thanks a lot
On the Template -> Graph page the only items I can select are:
Ping check icmpping Simple check Numeric (unsigned) Enabled
Red alarm RedAlarm SNMPv3 agent Numeric (unsigned) Enabled
Uptime Uptime SNMPv3 agent Numeric (unsigned) Enabled
Yellow alarm YellowAlarm SNMPv3 agent Numeric (unsigned) Enabled
no CPU/Memory/Temperature.
I would prefer to have the creation of the graphs in the template though as we have more then 50 devices.
you can see the template name at the Configuration- > host-> triggers
and search for this trigger.
because the item you choose if you didnt created it then it means it is a part of a template
you just need to find it.
if not- after creating this grafe select it - and copy it to some template
Comment
-
it seemes that the CPU item comes fron the template JunOS Hardwere
so create it in this template with the item jnxOpretionCPU.[1]
it should give you the correct Graph.
go to this template and create there the Graph with this existing item it should be easy
as the item is already there.Comment


Comment