Ad Widget

Collapse

What defines the zoom time range?

Collapse
X
 
  • Time
  • Show
Clear All
new posts
  • --JayJay--
    Junior Member
    • Jan 2017
    • 4

    #1

    What defines the zoom time range?

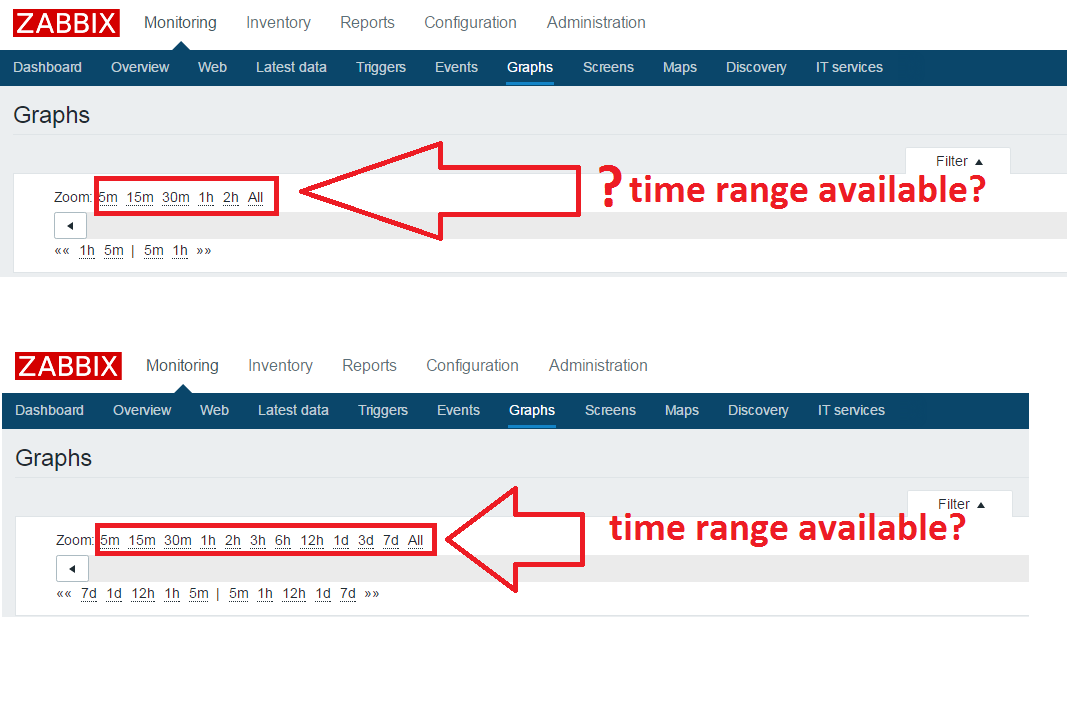
    What defines the time range of the data available in monitoring/graphs?

    From all items for which data are collected I can only graph the last 3 days in the menu monitoring/graphs.
    Although data of hosts and items are collected for over a week , and should be in the database for for that period.
    Seems like only last couple of days of history is available in the graph.


    Zabbix version is 3.01. on Debian Jessie (8).
    Last edited by --JayJay--; 06-02-2017, 16:02.
  • --JayJay--
    Junior Member
    • Jan 2017
    • 4

    #2
    To make clear what the question is, here's a screenshot.

    What defines the time range available in the Monitoring/graphs?
    Is it the availability of data?
    Does any of you suffer from data loss of history in Zabbix, as I can't go back to when the monitoring started for some of the hosts / items, although history and trend setting should support the time range I would like to graph.

    Comment

    • Pada
      Senior Member
      • Apr 2012
      • 236

      #3
      Yes, those time offset and zoom values depend on whether the values exist for that item/graph for that time period.

      For example if you only added that host or items 2h ago, then you'll only be able to zoom out to 2h (or "All"), where as if you had a graph with 2 years worth of data and you kept 740 days worth of trends, you'll be able to zoom out to like 2 years.

      Comment

      • --JayJay--
        Junior Member
        • Jan 2017
        • 4

        #4
        another example

        the image/screenshot showing logged statistics of an ethernet port of a monitored host, with data available for one day in monitoring/graph.
        But for sure I activated the logging way before febr. 7th at 00:00 AM.
        And I 've seen that data in graphs before.
        But now it seems gone as the time range is limited , starting from febr. 7th 00:00 AM
        ....how can I graph it ?
        The host has had a reboot about 6 hours ago , anything to do with this ?


        how do i upload a picture
        Last edited by --JayJay--; 08-02-2017, 18:56.

        Comment

        • --JayJay--
          Junior Member
          • Jan 2017
          • 4

          #5
          done mysql search for data of about 5 days ago, not retrievable in graph, like simple icmpping data:

          select * from zabbix.history_uint where itemid = '23666' AND (clock > 1486155056 OR clock < 1491252656) ORDER BY clock DESC limit 2500;

          also added housekeeping settings screenshot.


          Comment

          Working...