
Hi,
I'v notice a strange problem with graphs (1.4.1) - when showing more then few days (only with some graphs), shown data are completely inaccurate. When I choose to show last values of specific period - everything is ok.
Here is an example
This is OK 3 days graph
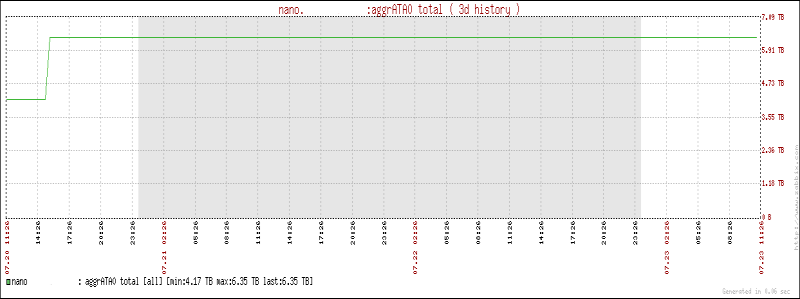
This is wrong 4 days graph (should be like before till 20 July ~4TB and after 6TB)
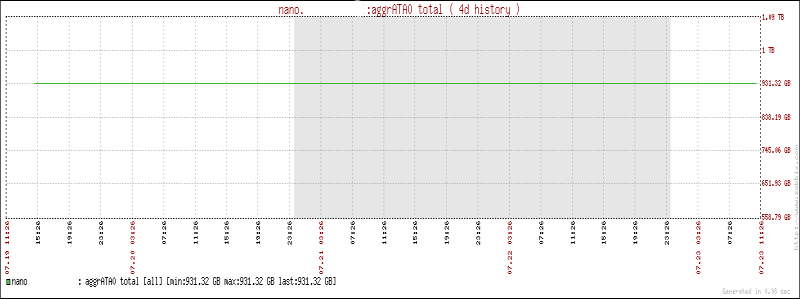
And here are values for period of last graph (4 days)
Any idea what can be wrong - is this bug known already?
--
Regards
Adrian (Sauron) Siemieniak /,/ .. Who can destroy The Thing,
sauron{at}rpg{dot}pl /`/ controls The Thing ... (DUNE)
I'v notice a strange problem with graphs (1.4.1) - when showing more then few days (only with some graphs), shown data are completely inaccurate. When I choose to show last values of specific period - everything is ok.
Here is an example
This is OK 3 days graph
This is wrong 4 days graph (should be like before till 20 July ~4TB and after 6TB)
And here are values for period of last graph (4 days)
Any idea what can be wrong - is this bug known already?
--
Regards
Adrian (Sauron) Siemieniak /,/ .. Who can destroy The Thing,
sauron{at}rpg{dot}pl /`/ controls The Thing ... (DUNE)
 - for this case should be enough
 I'v checked and it's working - in this case it was easy to fix all data in trends (for this itemid) , because there was only one change of it in entire history
Comment