

Table of Contents
6 Monitor network traffic with Zabbix
Introduction
This page walks you through the steps required to start basic monitoring of your network traffic with Zabbix.
Who this guide is for
This guide is designed for new Zabbix users and contains the minimum set of steps required to enable basic monitoring of your network traffic. If you are looking for deep customization options or require more advanced configuration, see the Configuration section of Zabbix manual.
Prerequisites
Before proceeding with this guide, you need to download and install Zabbix server, Zabbix frontend and Zabbix agent according to the instructions for your OS. As a starting point, the Installation from packages, followed by the Web interface installation, would be the advised solution. Note that you should install Zabbix agent on the machine that requires traffic monitoring. This can be either the same host where Zabbix server is installed or a different host.
This guide will provide the instructions on configuring the network traffic monitoring of eth0 interface on a separate machine named Remote host.
Configure Zabbix for monitoring
Zabbix agent can collect metrics in active or passive mode (simultaneously). See Passive and active agent checks for more info. In this guide, monitoring by means of passive checks will be described.
Configuring Zabbix agent
1. Open the agent configuration file on the machine where the agent is installed (by default, the path is /usr/local/etc/zabbix_agentd.conf):
2. Add the IP address or DNS name of your Zabbix server to the Server parameter. For example:
3. Restart Zabbix agent:
Zabbix frontend
1. Log into Zabbix frontend.
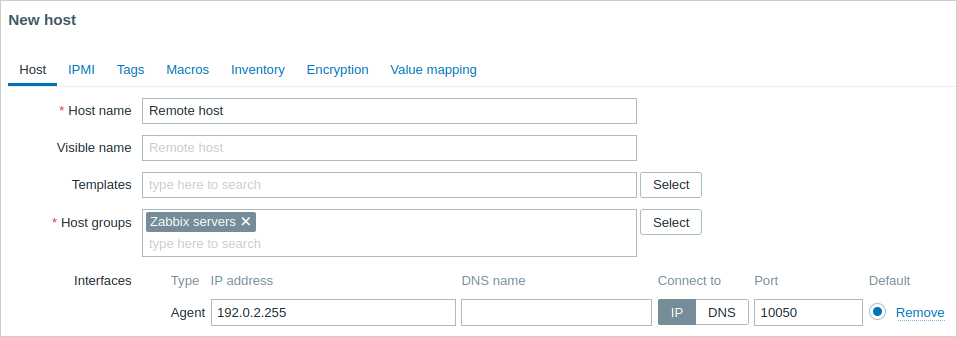
2. Create a host in Zabbix web interface, specifying the IP address or DNS name of the machine on which the agent is installed.
Create items
Follow the instructions on creating an item to add the items for traffic monitoring, namely:
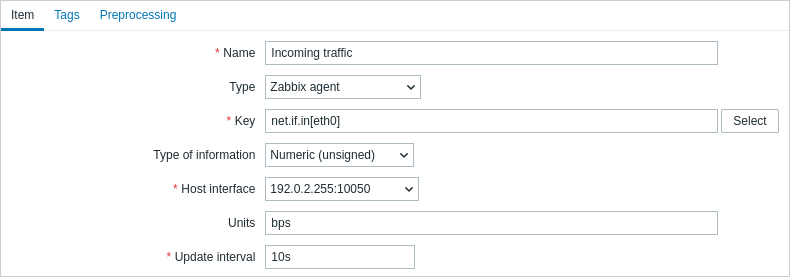
A simple setup for the incoming traffic monitoring item would look as follows:
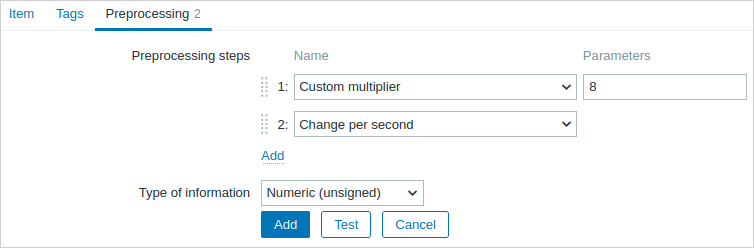
To make the collected data suitable for practical use, you can set some preprocessing steps when creating the items. In the given case, those can be multiplication by 8 (to convert bytes to bits) and presentation as change per second.
View collected data
Congratulations! At this point, Zabbix is already monitoring your network traffic.
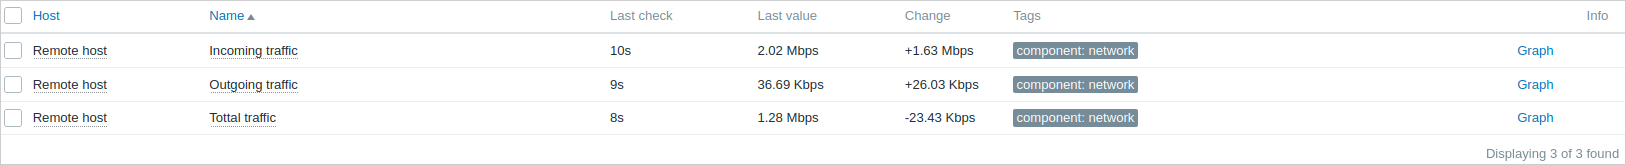
To view collected metrics, open the Monitoring → Hosts menu section and click on the Latest data in the row of the host.

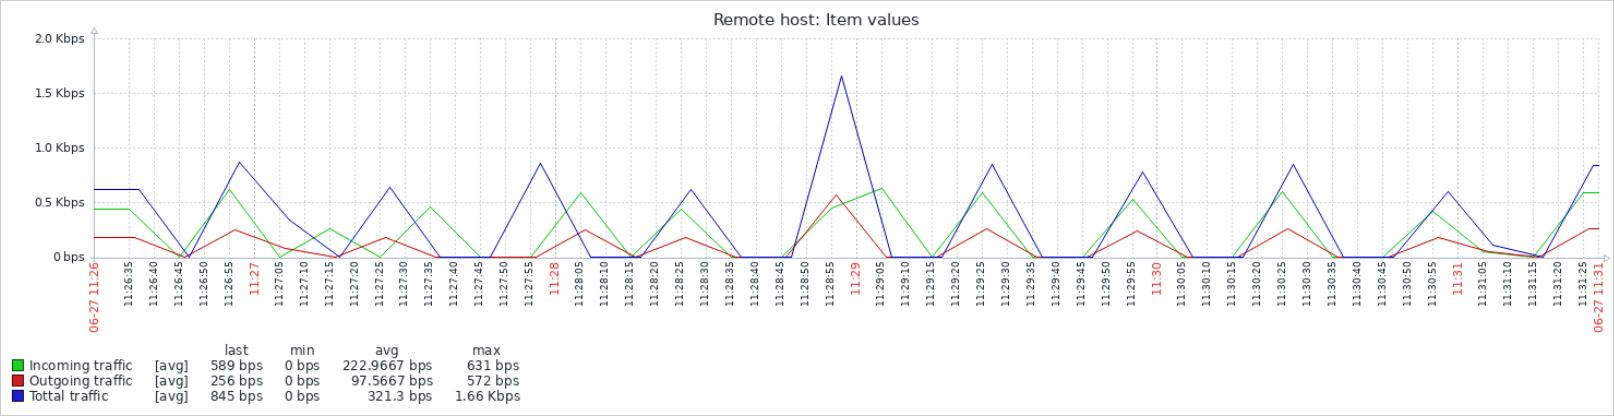
You will see the traffic data.
View graphs
The data collected can be displayed as graphs. To view those, in the Latest data section click on Graph in the row of the item or select required items and click on Display graph below.
Configure triggers
You can set triggers to detect abnormal network traffic. See the instructions on configuring a trigger and add the trigger signalling that the total traffic is too high, for example:
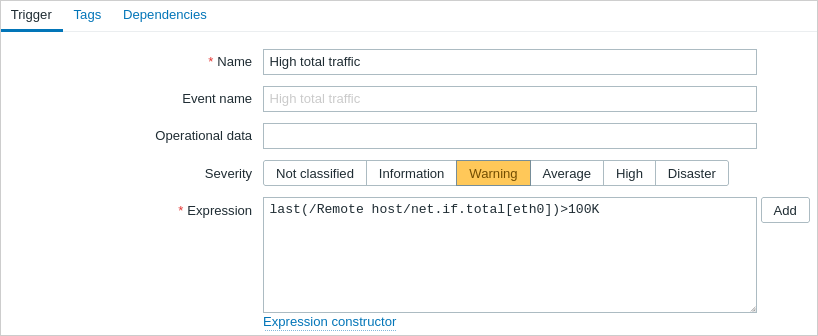
Now make the traffic exceed the threshold you have set in the trigger expression and navigate to the Monitoring → Problems to check that the problem is listed there.

Set up problem alerts
There are several ways of getting notifications about the problem. Email being the most popular one, follow the instructions on setting up a problem notification via email. You can also choose other media types to be used for the notification delivery.
See also:
- Problem escalations - how to create multi-step alert scenarios (e.g., first send message to the system administrator, then, if a problem is not resolved in 45 minutes, send message to the data center manager).
- Problem acknowledgment - how to indicate that the problem is known, make comments on resolving it, suppress or close the problem.
- Monitor Linux with Zabbix agent - how to start basic monitoring of the most important items by linking a pre-configured template.