Synthetic monitoring helps with creation of complex scenarios for reliable monitoring of WEB applications and APIs:
Forget about tracking your metrics manually. With Zabbix you can detect problem states within the incoming metric flow automatically:
Zabbix provides its users with very flexible, intelligent threshold definition options. While a threshold for trigger may be as simple as "bigger than x", it is possible to use all power of supported functions and operators for statistical analysis of history data.
While it is nice to have thresholds for problem detection, it's more efficient to react to issues proactively. Zabbix predictive functions can help you achieve that goal:
Defining problem thresholds manually is not always an efficient approach. In dynamic environments where the baseline values can periodically change it is important to automatically calculate a reference point against which the problem threshold will be calculated. Zabbix Baseline monitoring enables you to do just that:
Use multiple messaging channels to notify the responsible person or people about the different kinds of events occurring in your environment:
Define different messages for different messaging channels. You can either utilize the default message templates or create and customize your own message template:
Define escalation scenarios of varying complexity depending on the required workflow. From simple notifications and escalations to different users, to delayed notifications and automatic issue remediation:
With Zabbix you can not only receive a notification about a problem but also automatically resolve it. A remediation script or command can be executed to attempt and resolve the issue:
Execute a remediation script to:
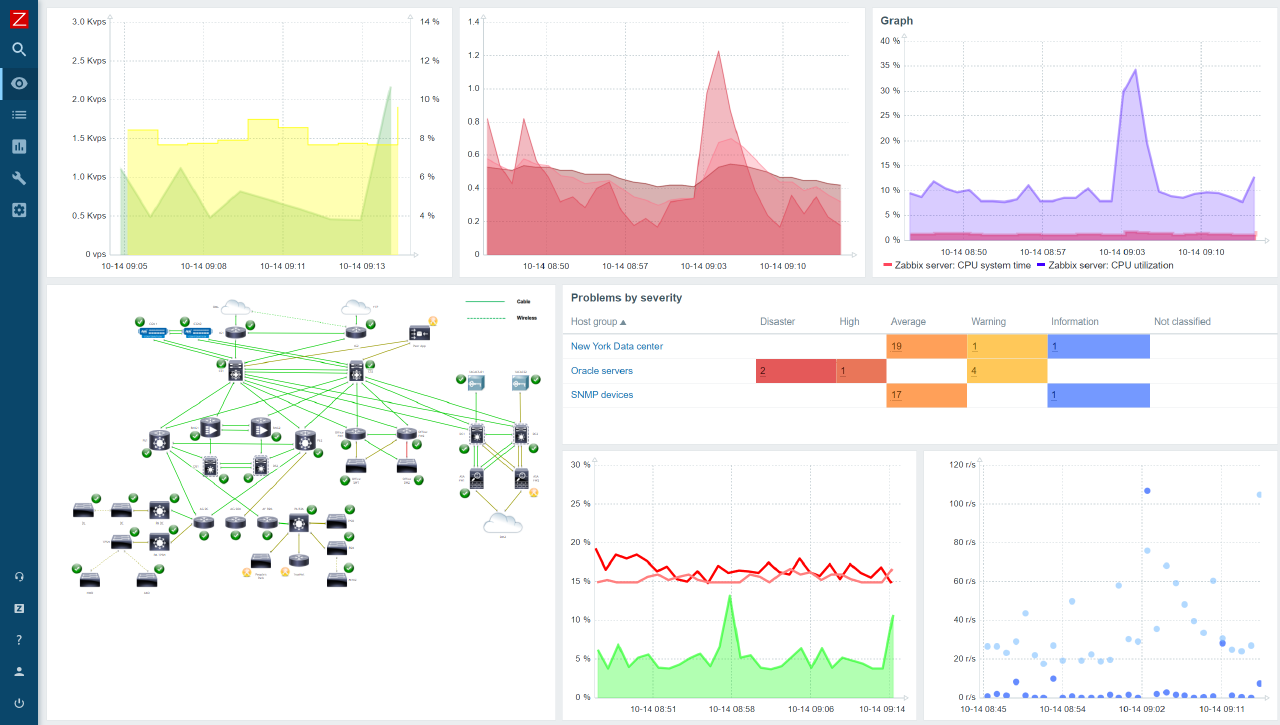
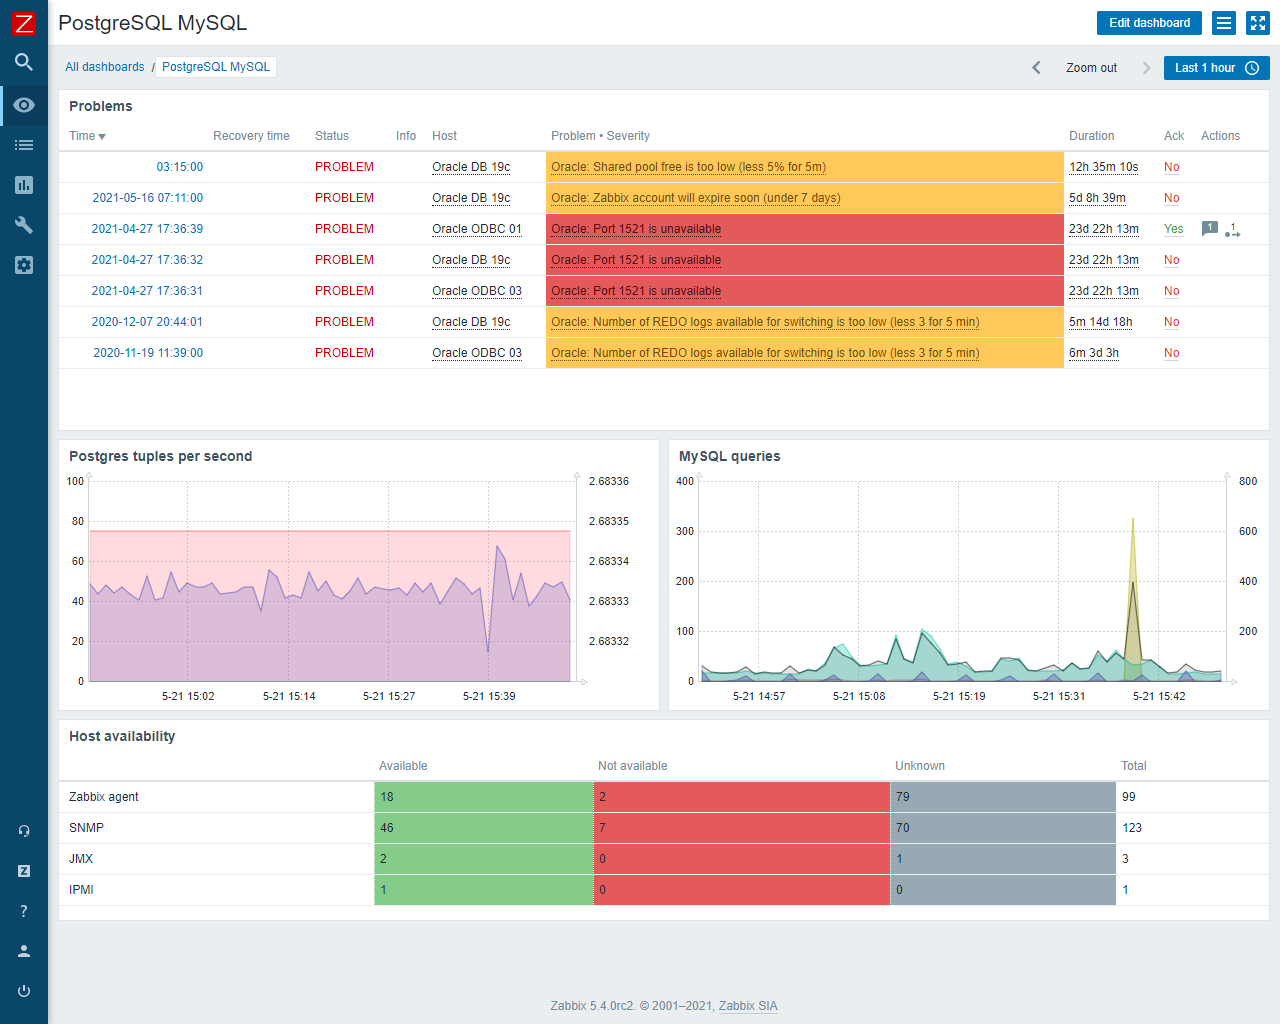
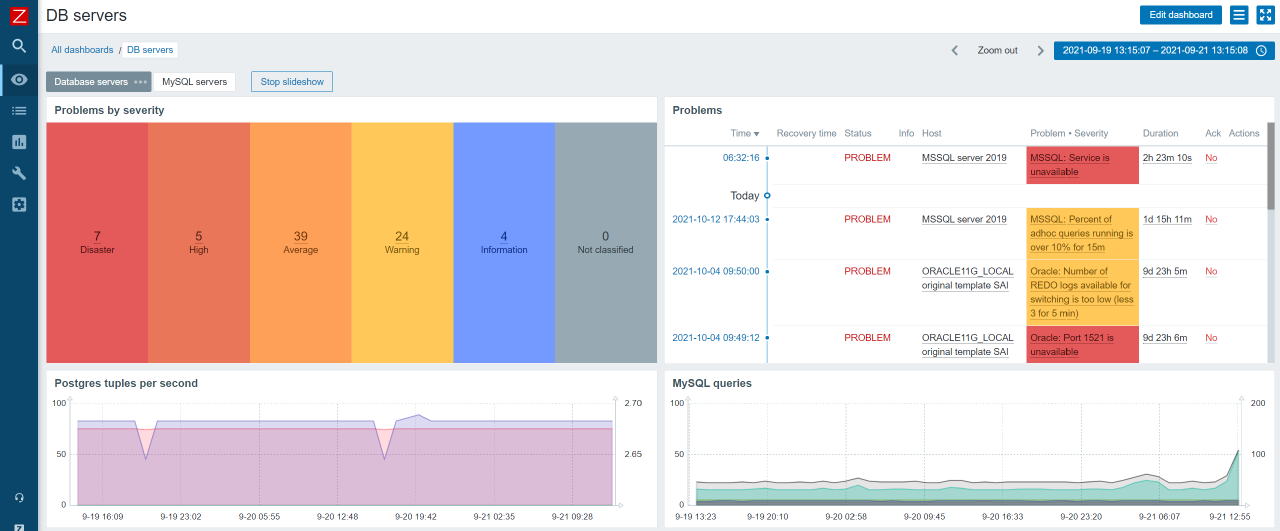
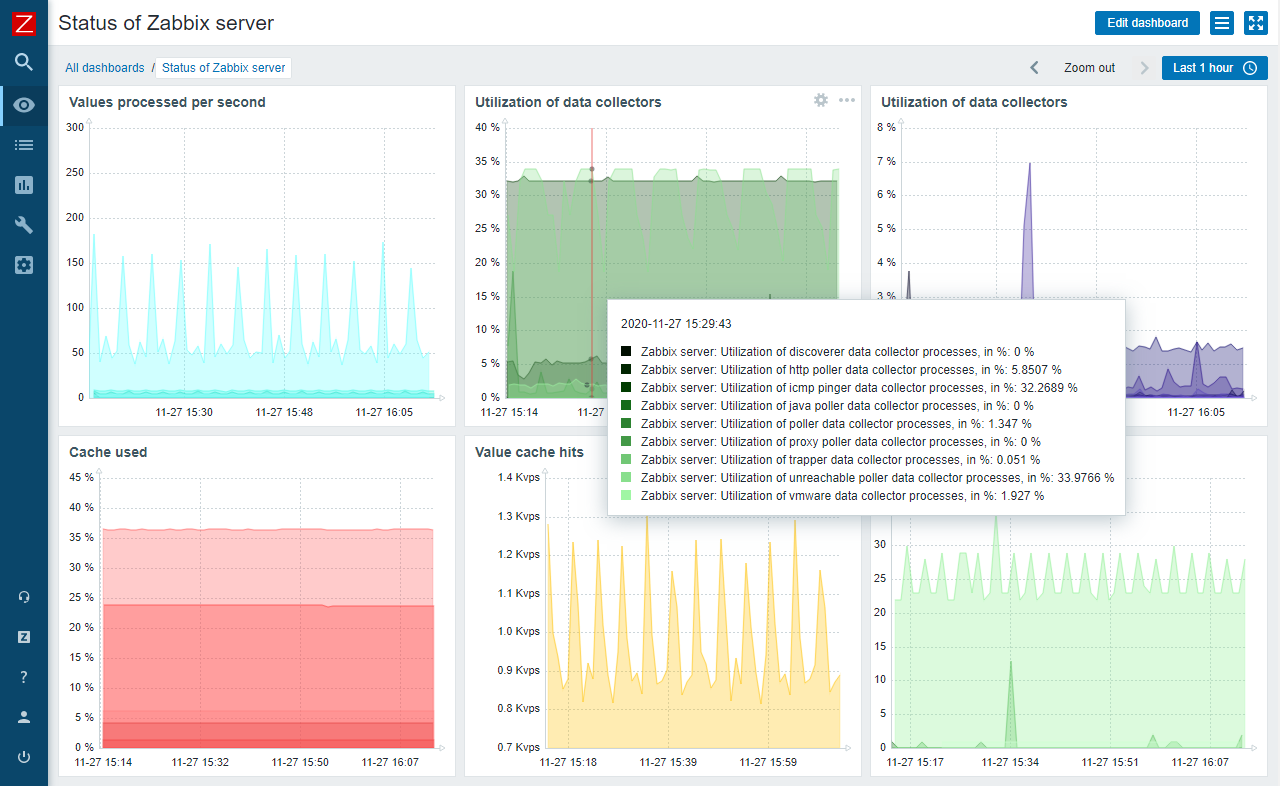
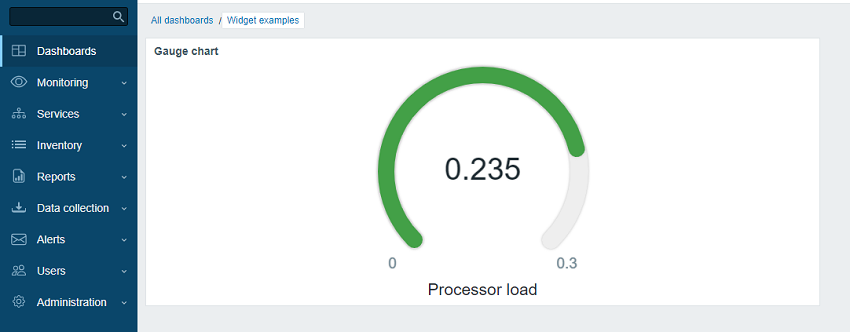
Define widget-based dashboards displaying relevant information:
Access your metrics, problems, reports and maps with a click of a button.
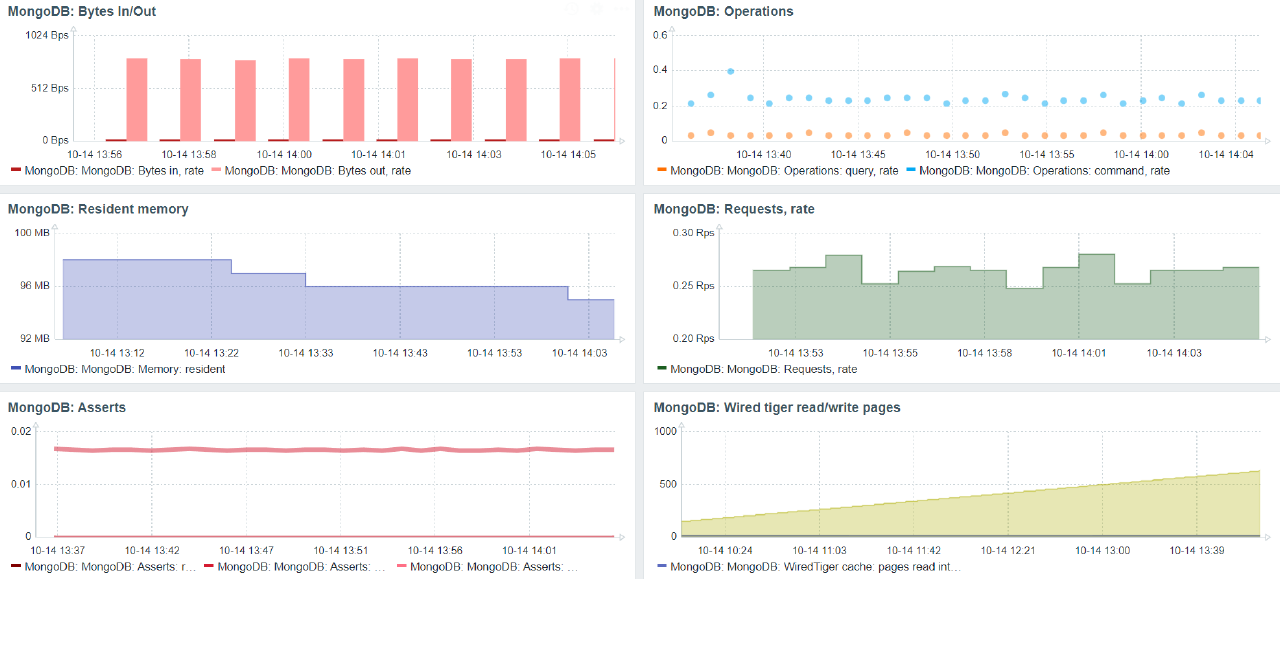
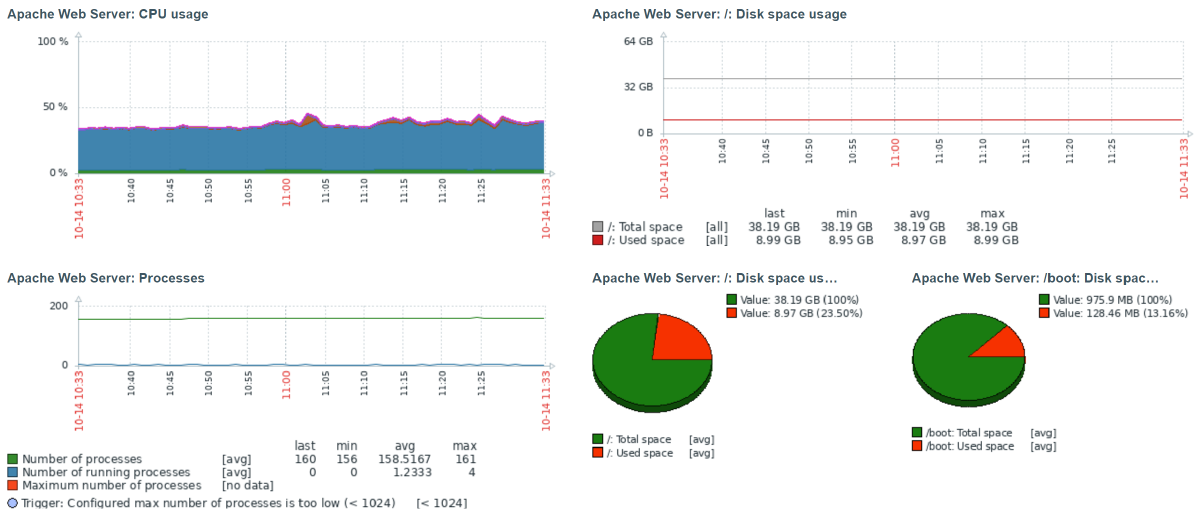
Define custom graphs or access ad-hoc graphs with a click of a button:
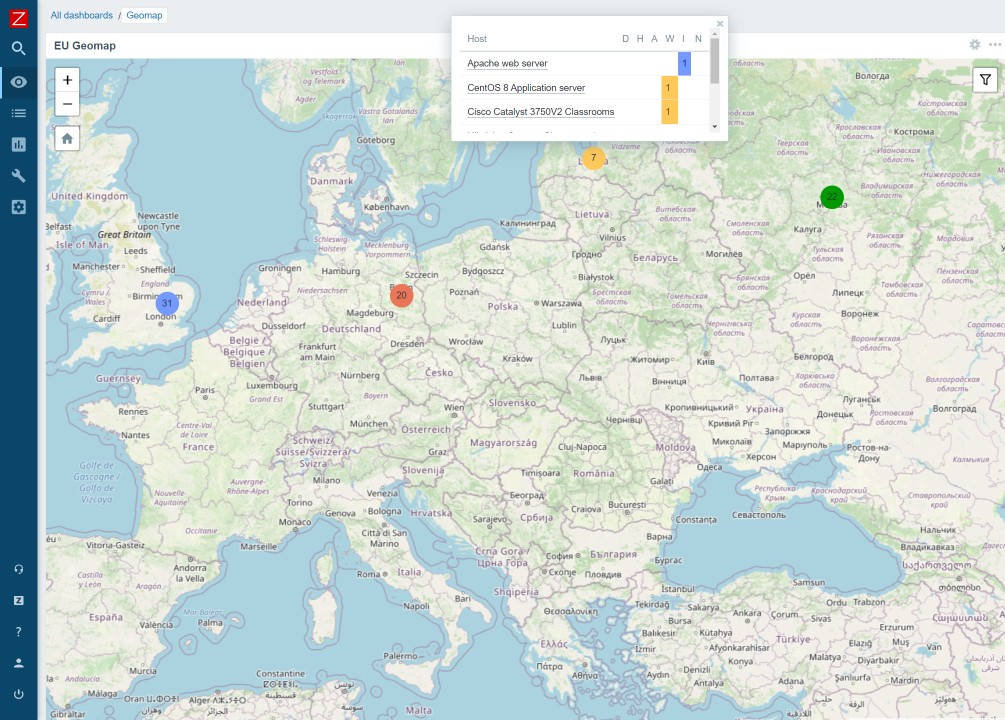
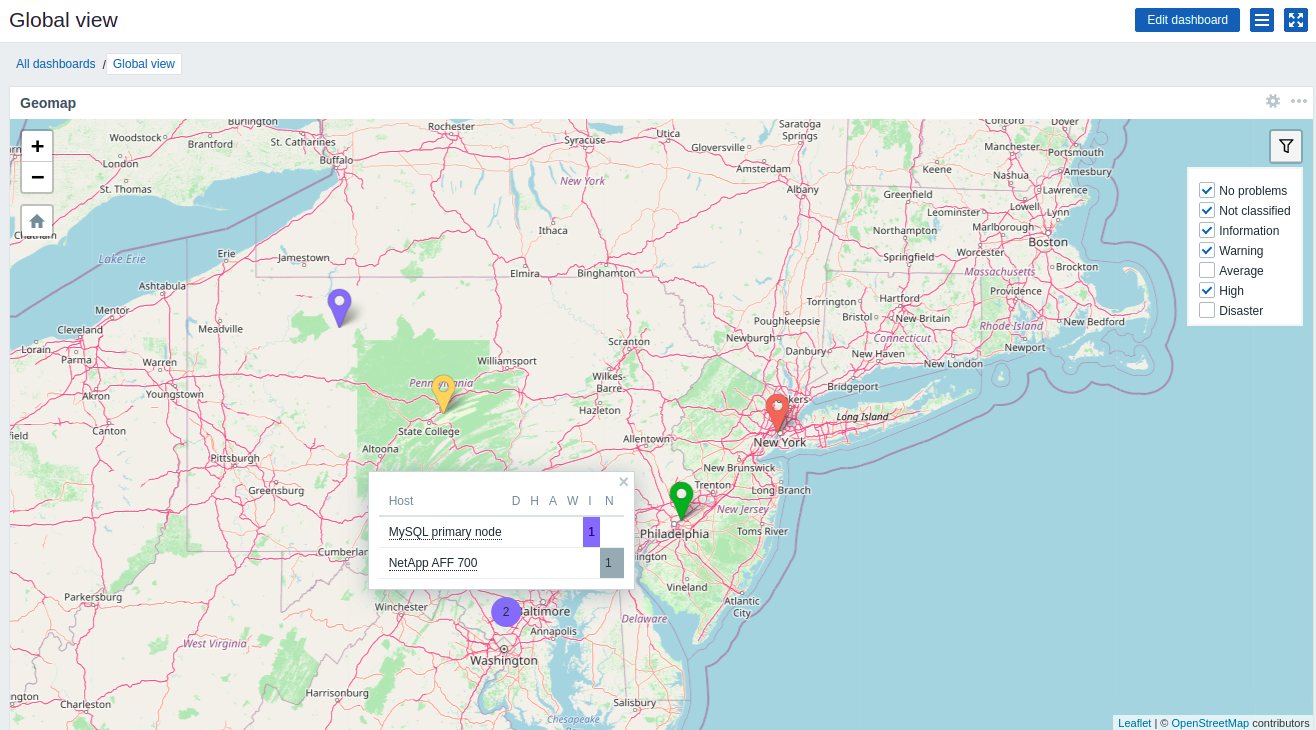
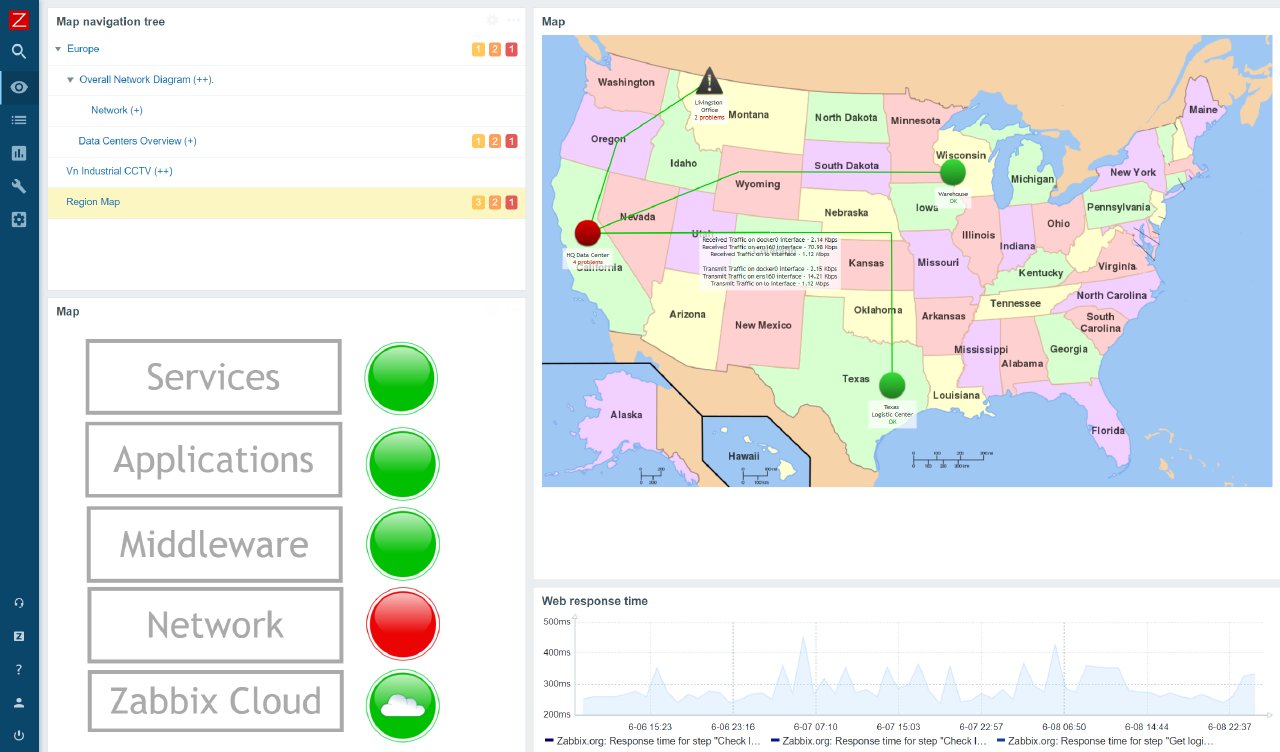
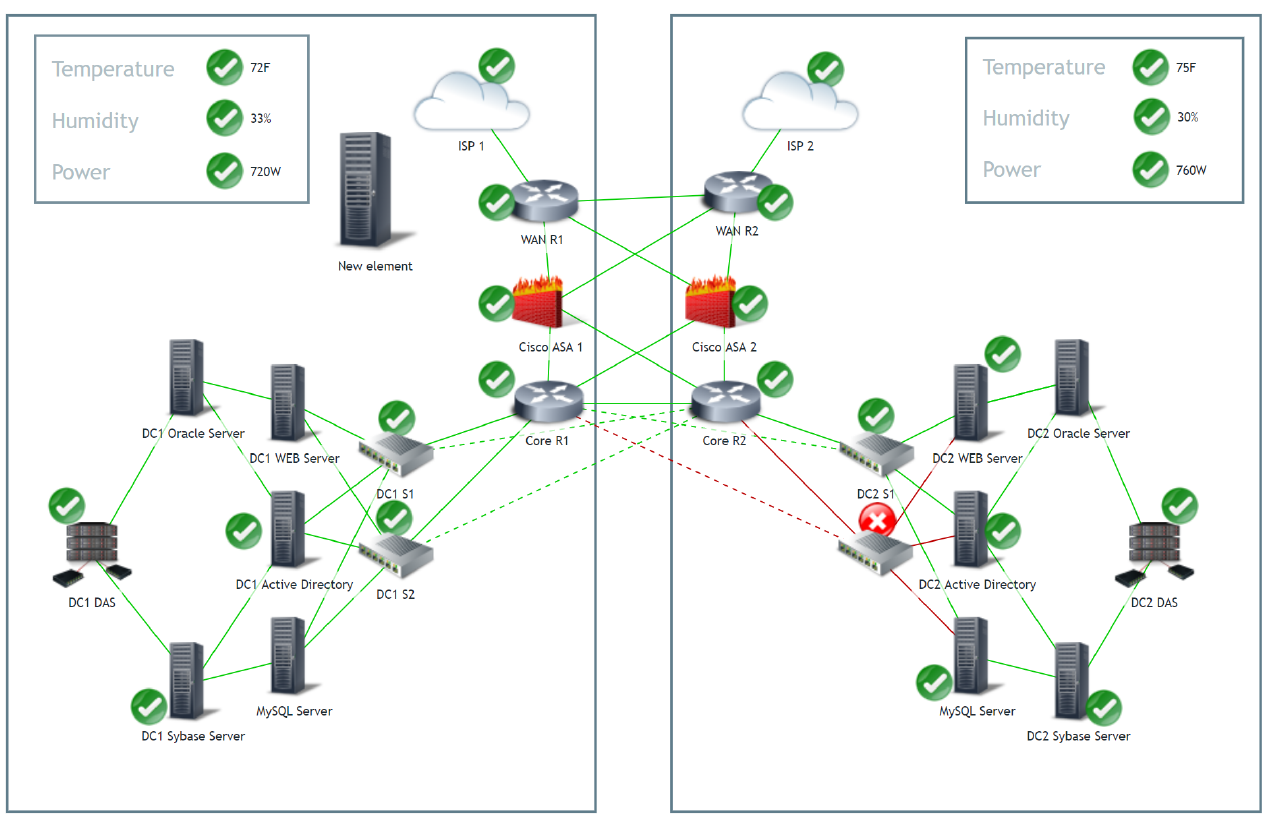
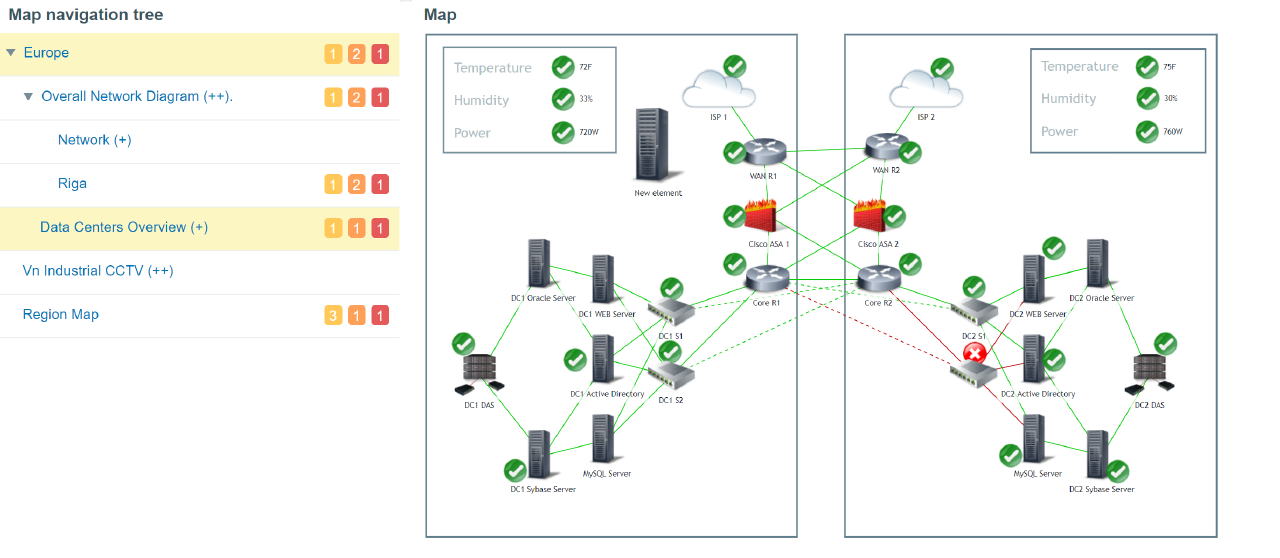
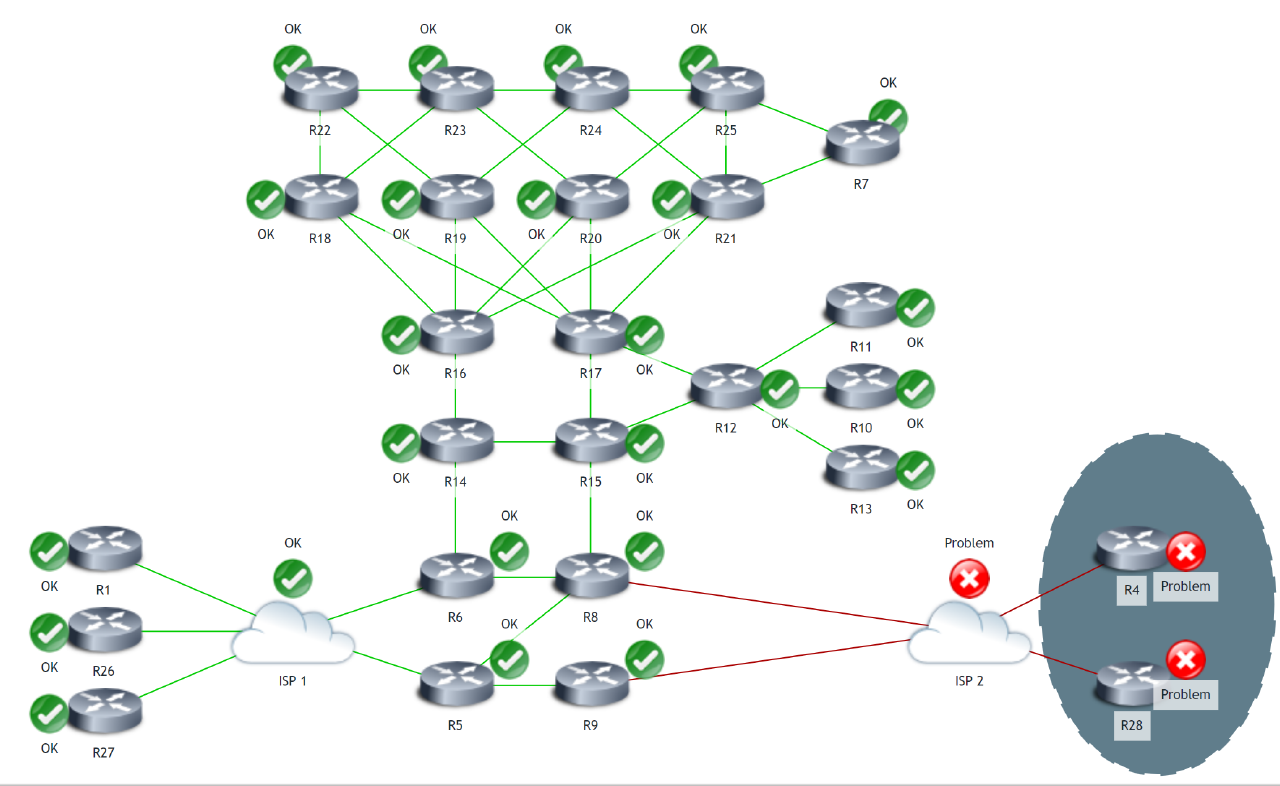
Display statuses of your elements together with real time data to get a detailed overview of your infrastructure on a Zabbix map:
Receive scheduled PDF reports providing useful statistics of your environment:
Now any Zabbix dashboard can be turned into a PDF report!

Automatically collect and store inventory information:
Correlate existing and incoming problems and perform root cause analysis:
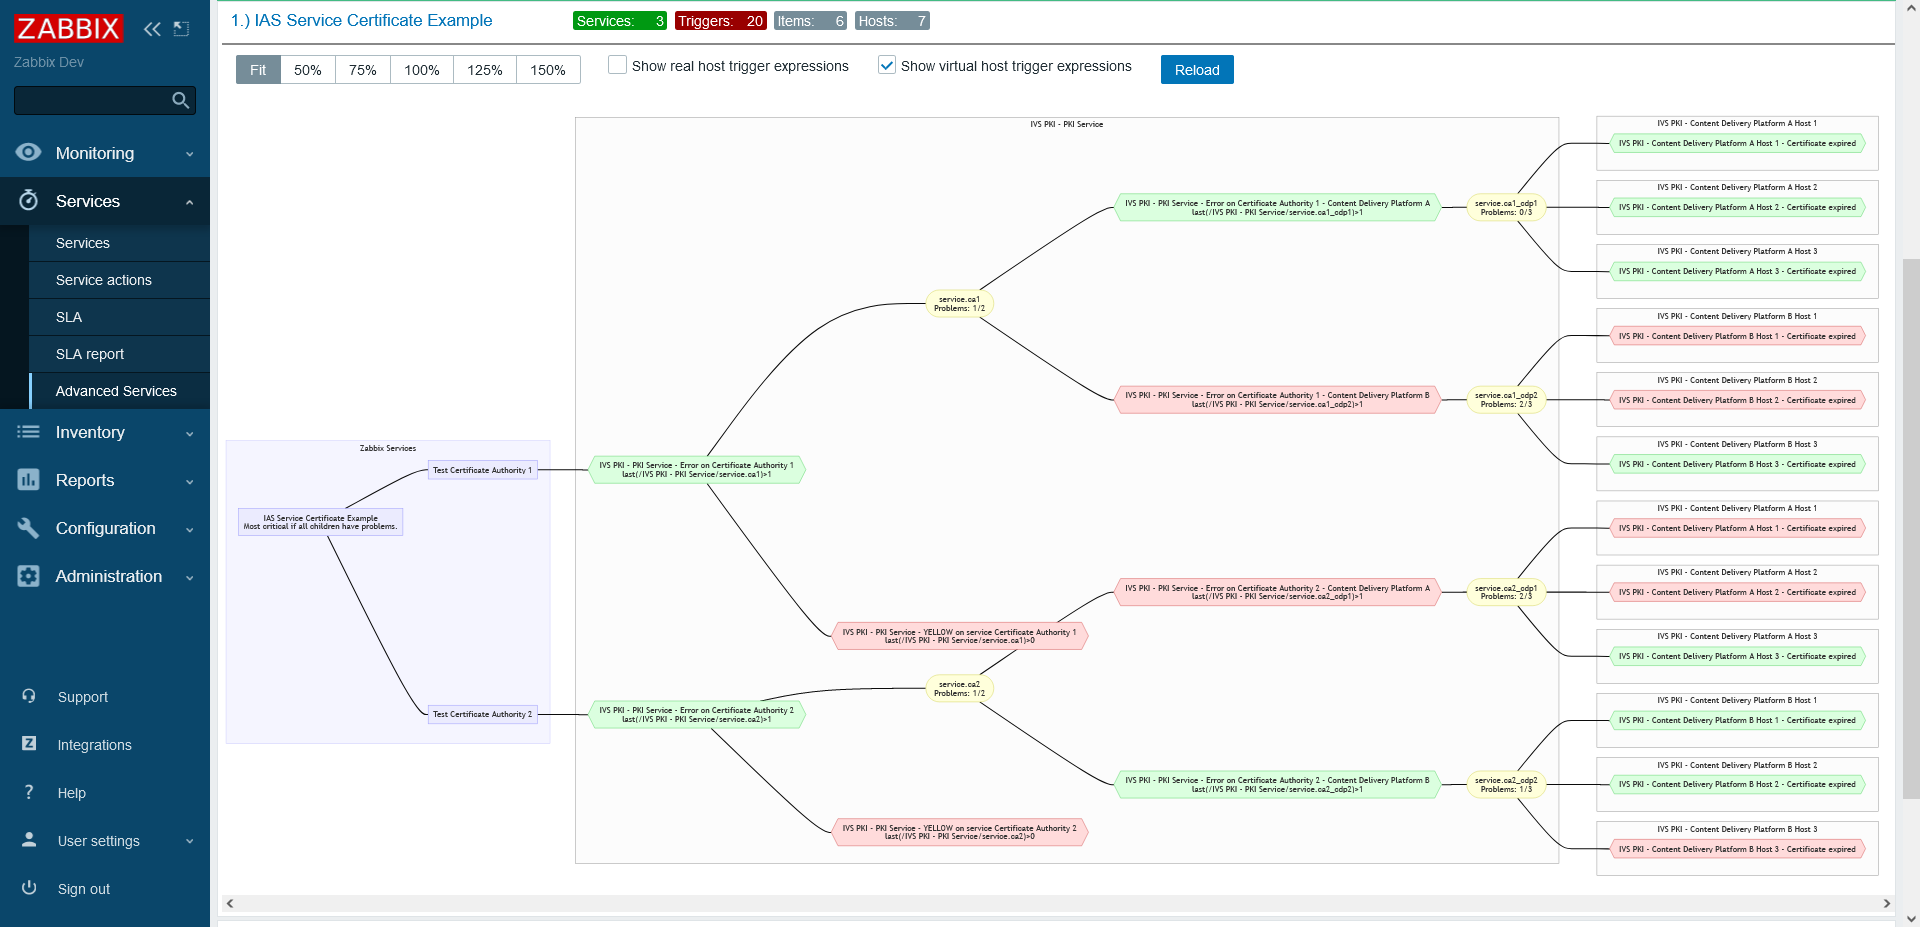
Define services and create service trees to perform impact analysis:
Business services provide full support for multi-tenant environments with a flexible permission schema:
Define services and service components with custom SLA calculation logic:
Integrations are provided in a form of customizable JavaScript webhooks:
Kubernetes monitoring also enables you to monitor Kubernetes components, such as:


Gain additional insights from your metrics and events by streaming them to an external AI engine, or stream them to a data lake or data warehouse for long-term storage and analytics.
Zabbix supports encrypting any communication stream between different Zabbix components:
Zabbix provides a flexible user permission schema which can be efficiently used to manage user permissions within one Zabbix installation or in a distributed environment.
You can define three levels of permissions:
User types are used to define access to administrative functions and to specify default permissions:
Create your own custom user roles with a granular set of permissions for different types of users in your environment.
User roles also enable you to Hide or show Zabbix UI elements to fit the needs of your users and customers.
With user Roles you can:
Integrate Zabbix together with your existing authentication mechanisms. Zabbix supports a variety of authentication methods:
With native support for HTTP, LDAP and SAML authentication you can provide an additional layer of security and improve the user experience while working with Zabbix.
Once entered, you have the option to hide your sensitive information from prying eyes:
Deploy an external vault to keep your secrets under tight control:
Track changes in your environment by utilizing the Audit log:
Restrict access to sensitive information by limiting which metrics can be collected in your environment:
Zabbix provides many different ways how you can deploy individual Zabbix components:
Vast selection of out-of-the-box templates provides the ability to immediately start monitoring your infrastructure:
Zabbix will automatically scan your network and add discovered devices for monitoring:
Scan your network hosts for availability by scanning for different services:
Resource discovery enables Zabbix to automatically discover metrics on your monitoring endpoints:
Resource discovery is virtually limitless. Discover entities such as:
Automatically discover your Zabbix agents and start monitoring them immediately:
Define custom device onboarding logic, depending on the agent metadata:
Add an extra layer of scalability by deploying Zabbix proxies. Scale up to collect millions of metrics from hundreds of thousands of devices, services, applications, and more. Zabbix proxies are easy to deploy and enable unlimited vertical scalability:
Monitor locations all over the globe! Collect metrics from remote locations securely and prevent data loss even in case of a network outage. By deploying Zabbix proxies you can:
With Zabbix proxies you can execute remote commands in remote locations - either on the proxies themselves or on the agents monitored by the proxy.
Zabbix is capable of storing history metrics and collecting hourly metric trends for an unlimited time period.
For example, to preserve database storage space, you may opt-in to store the history data for 6 months while storing hourly trends for 2 years:
You can use Zabbix for a lot more than just monitoring your own infrastructure! With Zabbix you can provide monitoring services for multiple customers in a multi-tenant environment

Zabbix positions itself as a universal monitoring solution for all possible use cases. Zabbix is 100% free and open-source, released under the GNU Affero General Public License version 3 (AGPLv3). This provides many unique benefits that you won’t find with proprietary software:

Zabbix frontend and documentation are available in many different languages. Our goal is to make Zabbix easy to use for people all over the globe. With Zabbix community localization tools you have the opportunity to help us translate Zabbix into your language.
You can read more about and take part in the Zabbix community translation effort here
Zabbix is a professionally developed open-source software with no limits or hidden costs.