
- 5 What's new in Zabbix 5.4.0
- New expression syntax for triggers and calculated items
- Multi-page dashboards
- Item tags have replaced "applications"
- Scheduled PDF reports
- Central location for scripts
- Host availability on the interface level
- API tokens
- JavaScript objects
- XML to JSON preprocessing option
- Strong encryption protocols for SNMPv3
- Trend function cache
- New LLD rule filter condition operators
- Databases
- Items
- Macros
- Webhook integrations
- New templates
- User alias renamed to username
- Frontend
5 What's new in Zabbix 5.4.0
New expression syntax for triggers and calculated items
A new syntax is now supported in triggers/calculated items aimed at resolving the known limitations of the former syntax.
The major changes and advantages coming with the new syntax are as follows:
- A unified syntax can be used in trigger expressions and calculated items (including aggregate calculations)
- Aggregated items no longer exist as a separate item type (former
aggregate functions, such as
grpsum,grpavg, etc have been changed tosum_foreach,avg_foreach, etc to be used in calculated items) - The new syntax is easier to use
- Item sets for aggregation can be specified using complex filters referencing the item key, host group and tags
- The new syntax supports other expressions as parameters
- Item reference is now the first parameter of history functions (as
host/item) - Changed syntax for expression macros
The outlined changes can be observed in the following examples:
| New syntax | Old syntax | Comment |
|---|---|---|
| last(/Zabbix server/temp)>20 | {Zabbix server:temp.last()}>20 | A simple trigger expression |
| nodata(/Zabbix server/tick,3m)=1 | {Zabbix server:tick.nodata(3m)}=1 | A simple trigger expression |
| min(min(/host/key,1h),min(/host2/key2,1h)*10,#20) | Not available/supported | Using other expressions as function parameters (referencing two different items) |
| 100*last(//vfs.fs.size[/,free])/last(//vfs.fs.size[/,total]) | 100*last("vfs.fs.size[/,free]")/last("vfs.fs.size[/,total]") | Calculated item, referencing the current host |
| sum(last_foreach(/*/vfs.fs.size[/,total]?[group="MySQL Servers"])) | grpsum["MySQL Servers","vfs.fs.size[/,total]",last] | Aggregate calculation (formerly, aggregate item) |
| avg(last_foreach(/*/system.cpu.load?[group="Servers A" and group="Servers B" and group="Servers C" and (tag="Service:" or tag="Importance:High")])) | Not available/supported | Aggregation with complex filters |
| {{?trendavg(//system.cpu.load,1M:now/M-1M)}.fmtnum(2)} | {{?{{HOST.HOST}:system.cpu.load.trendavg(1M,now/M-1M)}}.fmtnum(2)} | Expression macro |
All existing expressions will be converted to the new syntax during the upgrade.
See also:
Function changes
Several changes have been made to functions that now can be used in both triggers and calculated items:
- A new
findfunction replacesstr,regexp,iregexp - A new
absfunction replacesabschange(and now references the 'change' function to obtain absolute difference) - Functions
diff,prevhave been removed as redundant (use the functionlastinstead) - The
deltafunction has been removed (usemax-mininstead) - The
trenddeltafunction has been removed (usetrendmax-trendmininstead) bandhas been renamed tobitand(and now references the host item usinglastfunction)strlenhas been renamed tolength(and now references the host item using thelastfunction)- The first parameter for history functions now references the item key
- The order of parameters has changed for several functions
- The time and time shift parameters have been united as a one
time period:time shiftparameter (where time shift also supports absolute periods, e.g, midnight to midnight for a day, Monday-Sunday for a week, first day-last day of the month for a month) - Time functions are easy to use, e.g.
time()>000000 and time()<060000(a non-time-based function referencing the host must also be present in the expression, though)
See also:
New functions for triggers/calculated items
Many new functions have been added in the new version. Related functions are now organized in groups by the frontend.
| Function group | New functions |
|---|---|
| Aggregate functions | kurtosis, mad, skewness, stddevpop, stddevsamp, sumofsquares, varpop, varsamp |
| Bitwise functions | bitlshift, bitnot, bitor, bitrshift, bitxor |
| Date and time functions | - |
| History functions | countunique, find, first |
| Mathematical functions | abs, acos, asin, atan, atan2, cbrt, ceil, cos, cosh, cot, degrees, e, exp, expm1, floor, log, log10, mod, pi, power, radians, rand, round, signum, sin, sinh, sqrt, tan, truncate |
| Operator functions | between, in |
| Prediction functions | - |
| String functions | ascii, bitlength, bytelength, char, concat, insert, left, length, ltrim, mid, repeat, replace, right, rtrim, trim |
Click on the respective function group to see more details.
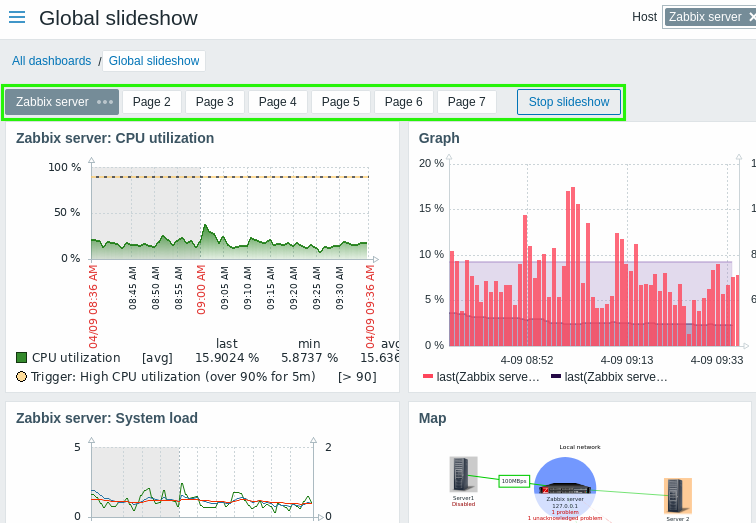
Multi-page dashboards
A Zabbix dashboard now supports multiple pages that can be rotated in a slideshow.
A slideshow may be run as soon as the dashboard contains two or more pages. The time interval for showing each page in the slideshow can be set for the whole dashboard, as well as for each page individually.
See also more details on creating a slideshow in dashboards.
Dashboards have replaced screens/slideshows
The "old" functionality of screens and slideshows in Zabbix has been removed, based on the advances in the functionality of Zabbix dashboards.
During the upgrade, each existing screen will be converted into a dashboard and each slideshow into a multi-page dashboard. See also additional details in the upgrade notes.
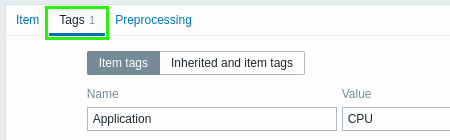
Item tags have replaced "applications"
In previous Zabbix versions "applications" were used as a means of grouping items and web scenario items. In the new version item tags have replaced applications. From now on, item tags must be used for grouping related items and web scenario items. Item tags are also an additional way to mark problem events.
Item tags are supported in items, item prototypes and web scenarios. The new tags are defined when configuring an item (item prototype, web scenario) in a new tab:
Conversely, all fields related to applications have been removed.
Existing applications and application prototypes will be transformed into item tags during the upgrade.
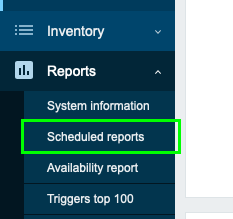
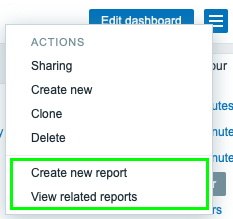
Scheduled PDF reports
Information from a dashboard can now be emailed as PDF reports. It is possible to configure reports to be sent out on a regular daily, weekly, monthly or yearly basis. Scheduled reports can be viewed and configured in the new menu section Reports → Scheduled reports or from the dashboard action menu for the currently opened dashboard.
 |
 |
A new Zabbix web service process should be installed to enable generation of scheduled reports.
Currently scheduled reports generation is in experimental status, with a production-ready status expected in the next major release.
See also:
Central location for scripts
Global scripts now also contain all scripts for action operations, and support JavaScript.
The maximum length of scripts has been increased to 65536 bytes.
Scripts moved from action operations to global scripts
All scripts for action operations have been moved to global scripts. No scripts are maintained with action operations any more. To execute a script as part of action operation, just select one of the global scripts designated for action operations (with 'Action operation' as Scope).
To make sure that one global script location can maintain scripts with various purposes a new 'Scope' setting has been added. When configuring a global script, it is possible to set the scope as:
- action operation
- manual host action
- manual event action
'Manual event action' here is another new feature, allowing to execute a command from the event menu. This feature may be handy for running scripts used for managing problem tickets in external systems. The event menu is now also available by clicking on the problem name in the problem widget of the dashboard.
A scope filter has been added in global scripts allowing to filter scripts by scope.
All scripts from action operations will be moved to global scripts during the database upgrade. {HOST.*} macros from these scripts, designed to resolve on the basis of the trigger expression that caused the event, will be replaced by a new set of {HOST.TARGET.*} macros, set to resolve to the parameters of the target host.
See also:
JavaScript global scripts added
Global scripts now support custom logic written in JavaScript with the ability to call external HTTP services.
To configure JavaScript code as global script, select the new Webhook script type:
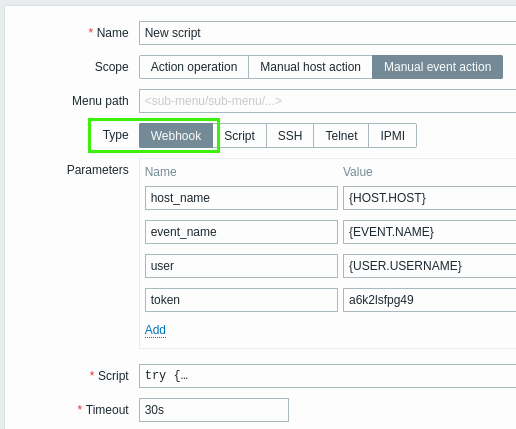
The Webhook script type offers three fields for adding the parameters, the JavaScript code and timeout.
Host availability on the interface level
All data about host availability have been moved from the host level to the level of individual interfaces. If a host has several interfaces of the same type and one interface becomes unavailable, it does not affect the availability of any other interface of the same type.
The way that host availability is displayed has been changed:
- Availability icons in the frontend are now only displayed for those interfaces (Zabbix agent, SNMP, IPMI, JMX) that have been configured on the host
- If you position the mouse over the availability icon, a popup list of all interfaces of this type appears with each interface details, status and errors
- Yellow has been added as a new status color for the availability icon
- The meaning of the availability icon colors has been updated as
follows:
- green - all interfaces of this type are available
- yellow - at least one interface of this type available and at least one unavailable; others can have any value including 'unknown'
- red - no interfaces of this type available
- gray - at least one interface of this type unknown (none unavailable)
- The
zabbix[host,<type>,available]internal item now reports availability of the main interface of a particular type of checks - The logic of counting host availability has also been updated in the Host availability dashboard widget (see details)
API tokens
Support of API authorization tokens has been added. Now it is possible
to access Zabbix API using either a token or a Zabbix username and
password for authorization. An opportunity to allow/deny management of
API tokens has been added to user role permissions. Super admins with
sufficient permissions can create and manage API tokens in the
Administration→General frontend
section
or via the new token.* API methods.
Other users with permission to manage API tokens can view tokens
assigned to them in user settings
or via API.
JavaScript objects
Naming
The 'CurlHttpRequest' object has been renamed to 'HttpRequest' for simplicity. The previous object naming is now deprecated and its support will be discontinued after Zabbix 6.0.
Methods also have been renamed for greater consistency with JavaScript:
| New naming | Old naming |
|---|---|
| log | Log |
| addHeader | AddHeader |
| clearHeader | ClearHeader |
| getHeaders | GetHeaders |
| get | Get |
| put | Put |
| post | Post |
| delete | Delete |
| setHttpAuth | SetHttpAuth |
| setProxy | SetProxy |
| getStatus | Status |
The previous method names are now deprecated and their support will be discontinued after Zabbix 6.0.
New, convenient aliases have been added for logging methods:
| New alias | Alias to |
|---|---|
| console.log(object) | Zabbix.log(4, JSON.stringify(object)) |
| console.warn(object) | Zabbix.log(3, JSON.stringify(object)) |
| console.error(object) | Zabbix.log(2, JSON.stringify(object)) |
XML object
New JavaScript object XML has been added to provide an ability to extract data by XPath and convert XML to JavaScript object (JSON) and vice versa.
See also: Additional JavaScript objects.
XML to JSON preprocessing option
New option XML to JSON has been added in item preprocessing and low-level discovery preprocessing.
Strong encryption protocols for SNMPv3
Support of strong authentication and privacy protocols for SNMPv3 has been implemented.
For authentication:
- SHA224
- SHA256
- SHA384
- SHA512
For privacy:
- AES192
- AES256
- AES192C (Cisco)
- AES256C (Cisco)
Also, after the upgrade the existing SHA and AES protocols will be renamed to SHA1 and AES128 respectively.
See also: Configuring SNMP hosts
Trend function cache
Previously, trend-based trigger functions (trendavg, trendcount, etc) would always use database queries to obtain the required data. In the new version, a trend function cache has been implemented allowing to cache the result of calculated trend functions. Zabbix server, when processing trend functions, will check the trend cache for the cached result. In case of failure the server will read data from database and cache the result.
The trend function cache may help to decrease the database server load when triggers contain trend functions mixed with history or timer-based functions.
The trend function cache size may be adjusted using the new
TrendFunctionCacheSize server
parameter. A new
zabbix[tcache,cache,<parameter>] internal
item has been implemented to
monitor the trend function cache effectiveness.
New LLD rule filter condition operators
In low-level discovery, it is now possible to set up filtering by the specified macro presence (or absence). Two new filter condition operators have been added: "exists" and "does not exist".
Databases
Supported versions
To create the optimal user experience and ensure the best Zabbix performance in various production environments, support of some older database releases has been dropped. Additionally, an upper limit for the supported DB versions has been introduced for all databases. Though Zabbix may still work with newer releases, the maximum supported DB version indicates the latest version Zabbix has been tested with and provided stable performance.
Starting from Zabbix 5.4, the following database versions are officially supported:
- MySQL/Percona 5.7.28-8.0.X
- MariaDB 10.0.37-10.5.X
- PostgreSQL 10.9-13.X
- Oracle 12.1.0.2 - 19c
- TimescaleDB 1.5-2.1
- SQLite 3.3.5-3.34.X
Direct connections to database removed from pollers
Direct connections to database have been removed from pollers, unreachable pollers and JMX pollers on Zabbix server/proxy.
Previously these connections were required for:
- Calculated items, aggregate checks and several internal items
- Host availability updates in case of Zabbix agent, SNMP, JMX items. Pollers, unreachable pollers, JMX pollers and the IPMI manager would update host availability directly in the database with a separate transaction for each host.
- Additionally host availability would be updated by the proxy poller thread and trapper when receiving host availability from Zabbix proxy and the configuration syncer when resetting host availability (host status changed, host moved to a new proxy, Zabbix proxy not available for too long)
Now, to handle calculated and internal checks a new poller type
history poller has been introduced. A new StartHistoryPollers
configuration parameter allows to customize the needed history poller
instances. As each history poller requires a database connection, it is
recommended to keep the number of instances as low as possible.
To deal with host availability updates, a new availability manager
process has been introduced. All processes queue host availability
updates to the availability manager and that queue is flushed by the
availability manager to the database every 5 seconds.
You can monitor the new processes using the zabbix[process,<type>] internal item.
Oracle setup
- When creating an Oracle database, it is no longer required to copy images to the Oracle host.
- Support of Net Service Name connection method has been added. Now Zabbix supports two types of connect identifiers (connection methods): Easy Connect and Net Service Name. See Oracle database setupfor more information.
Items
VMware cluster performance counters
A new vmware.cl.perfcounter[<url>,<id>,<path>,<instance>]
item allows
to retrieve VMware cluster performance counter metrics.
JMX items
JMX monitoring and discovery items jmx[], jmx.discovery[] and
jmx.get[] have a new third parameter - 'unique short description',
allowing to use multiple instances of the same check on the host.
See also:
Macros
- A new {ITEM.VALUETYPE} macro has been added returning the value type of the item. Possible values: 0 - numeric float, 1 - character, 2 - log, 3 - numeric unsigned, 4 - text.
- Time period handling of the fmttime macro function has become more flexible.
Webhook integrations
New integrations are available allowing to use the webhook media type for pushing Zabbix notifications to:
New templates
The following template is now available for out-of-the-box monitoring:
- Hikvision camera by HTTP - see setup instructions for HTTP templates.
You can get this template:
- In Configuration → Templates in new installations;
- If you are upgrading from previous versions, you can download the
template from Zabbix Git
repository
or find it in the
templatesdirectory of the downloaded latest Zabbix version. Then, while in Configuration → Templates you can import it manually into Zabbix.
User alias renamed to username
The system user name previously referred to in user configuration as "Alias" has been renamed to "Username".
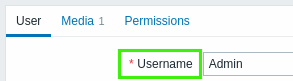
As part of the change, the {USER.ALIAS} macro is now deprecated. Use the new macro {USER.USERNAME} instead.
Frontend
Value mapping on template/host level
Value mapping is now configured on template/host level, in the template and host configuration forms respectively. Global value mapping has been removed.
During the upgrade, all global value maps that are used in items will be copied to the respective template or host.
Additionally:
- Value mappings can be mass updated
- Value map selection in item configuration has been renamed from Show value to Value mapping
- Item list can be searched for the value map used
See also: Value mapping
Value mapping by range, regular expression
Previously only exact matches could be used in value mapping. In the new version it is also possible to match ranges, a regular expression, as well as set a default value for unmatched values.
See also: Value mapping configuration
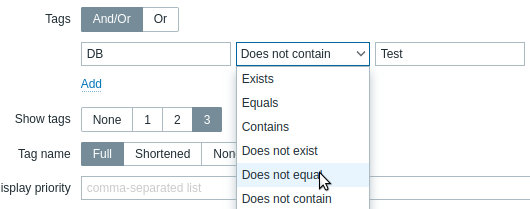
Negated filtering by tags
In several frontend filters it is now possible to filter entities:
- by tag name only
- based on tags not having the specified name or value
This is implemented by adding new operators "Exists", "Does not exist", "Does not equal" and "Does not contain" in the tag filter conditions.
These filtering changes are implemented in:
- Monitoring:
- Problem-related dashboard widgets (Graph, Problem hosts, Problems, Problems by severity)
- Problems
- Hosts
- Configuration:
- Templates
- Hosts
- Triggers
Unified global event correlation form
The form for configuring global event correlation is now a single page where the fields from, previously, two tabs have been combined onto one page.
Separated host and template entities
Items, triggers, graphs, low-level discovery rules, and web scenarios belonging to templates are now separated from the items, triggers, graphs, low-level discovery rules, and web scenarios belonging to hosts. Configuration section has been updated to reflect this change.
For template entities:
- the Host column and Hosts filter field are renamed to Template and Templates respectively;
- the Info column is no longer displayed;
- filters have been updated to offer only options that are relevant to templates (State, Discovery, and some other selectors have been removed);
- Execute now and Clear history buttons have been removed;
- Host group selector now allows selecting only host groups that contain at least one template.
For host entities, some drop-down filter selectors have been replaced with buttons, not affecting the functionality; Host group selector now allows selecting only host groups that contain at least one host; Hosts selector now allows selecting hosts only.
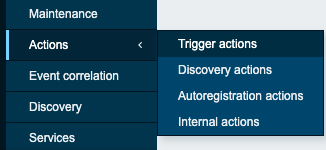
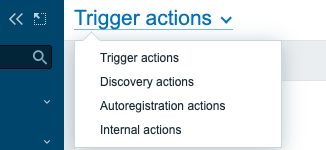
Third-level menu
Some sections of the main menu in Zabbix now have an additional menu level that appears upon a mouse-click. A small right arrow next to the section name indicates that this section has a third-level menu. This change affects only sections that contain multiple pages:
- Monitoring → Overview
- Configuration → Actions
- Administration → General
- Administration → Queue
The third-level menu is introduced as a more visible alternative to the title dropdown on the top of a page. The title dropdown is also still available, therefore users can select any of the two options for navigating between pages.
 |
 |
| Third-level menu. | Title dropdown. |
Hidden PSK data for hosts and proxies
PSK identity and PSK fields in host and proxy configuration are now write-only. Once saved, these values cannot be viewed again in the frontend or retrieved through API but can be replaced with new values. For hosts, PSK identity and PSK will no longer be exported.
Template import
It is now possible to rename a template, change trigger expression, or update other template elements by importing an updated version of the template. Templates themselves and template elements such as items, triggers, discovery rules, dashboards, etc. have been assigned unique IDs.
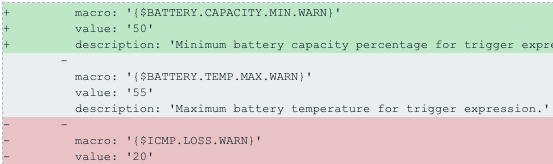
When importing a template it is now possible to review the changes being made and then confirm or cancel the import operation. Newly added template elements such as items, triggers, discovery rules, dashboards, etc. are highlighted in green (for a new template all elements will be green). Removed template elements are highlighted in red. Elements that have not changed are listed on a gray background.
Miscellaneous
- Mass update pages for hosts, templates, items, etc have been replaced by popup windows.
- Import pages for importing templates, hosts, maps, etc have been replaced by import popup windows.
- Import dialogues for hosts, templates, maps, and media types have been updated to show only options, that are related to the page, from where this popup has been opened (e.g. Import hosts popup no longer displays irrelevant checkboxes Screens, Maps, Images, and Media types).
- In global search results, all links are now visually separated under the Configuration and Monitoring headings.