
1 Dashboard
Overview
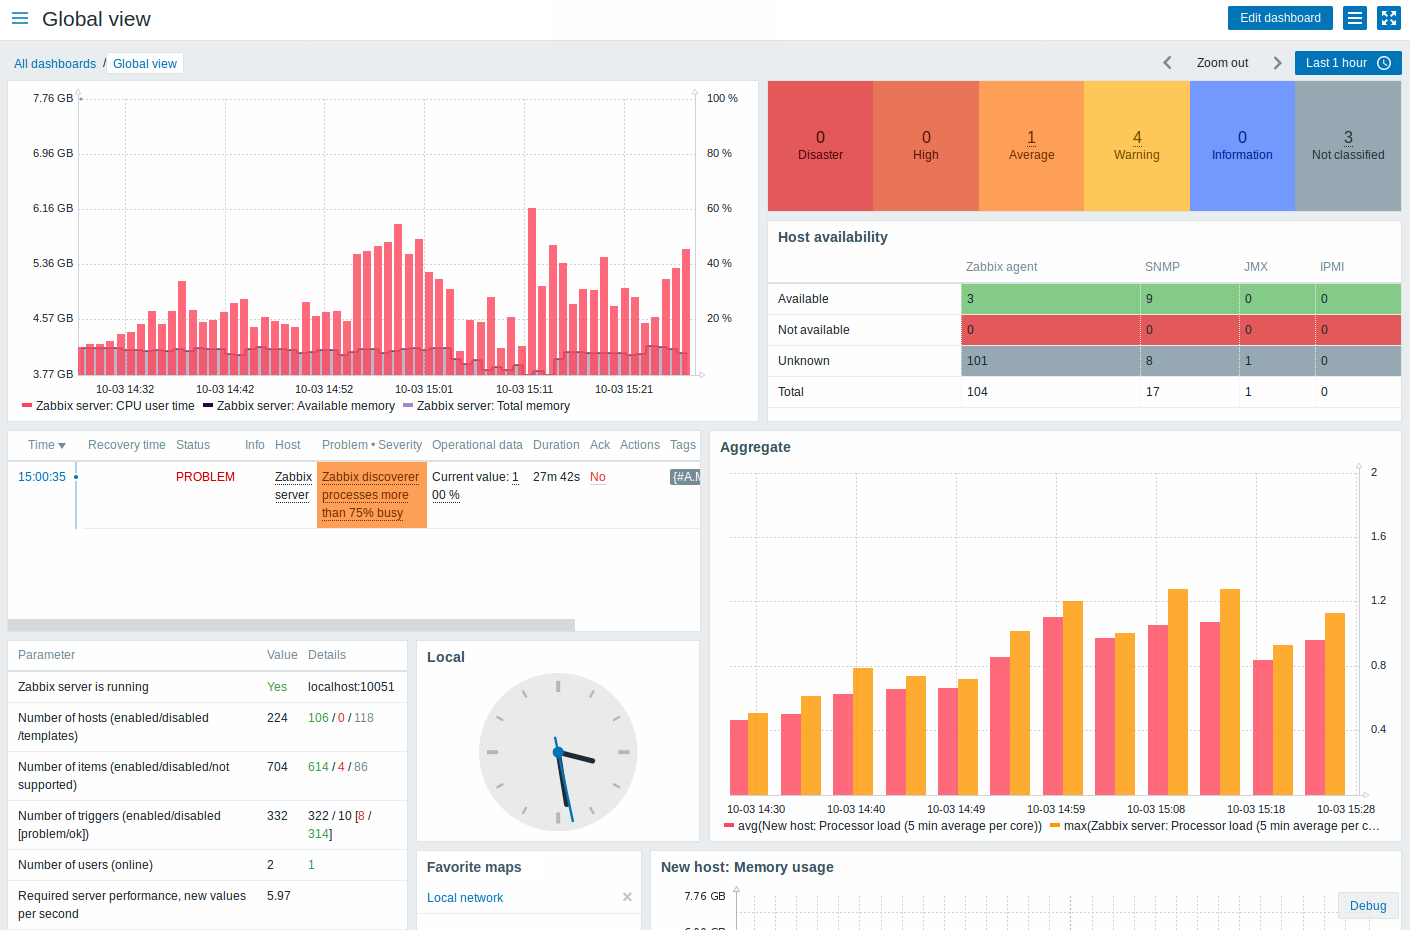
The Monitoring → Dashboard section is designed to display summaries of all the important information in a dashboard.
While only one dashboard can be displayed at one time, it is possible to configure several dashboards. Each dashboard may contain one or several pages that can be rotated in a slideshow.
A dashboard page consists of widgets and each widget is designed to display information of a certain kind and source, which can be a summary, a map, a graph, the clock, etc.
Pages and widgets are added to the dashboard and edited in the dashboard editing mode. Pages can be viewed and rotated in the dashboard viewing mode.
The time period that is displayed in graph widgets is controlled by the time period selector located above the widgets. The time period selector label, located to the right, displays the currently selected time period. Clicking the tab label allows expanding and collapsing the time period selector.
Note that when the dashboard is displayed in kiosk mode and widgets only are displayed, it is possible to zoom out the graph period by double-clicking in the graph.
Viewing dashboards
To view all configured dashboards, click on All dashboards just below the section title.
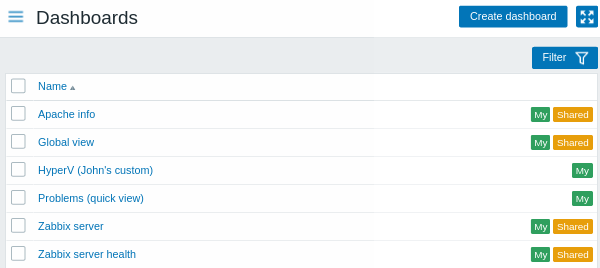
Dashboards are displayed with a sharing tag:
- My - indicates a private dashboard
- Shared - indicates a public dashboard or a private dashboard shared with any user or user group
The filter located to the right above the list allows to filter dashboards by name and by those created by the current user.
To delete one or several dashboards, mark the checkboxes of the respective dashboards and click on Delete below the list.
Viewing and editing a dashboard
To view a single dashboard, click on its name in the list of dashboards.
When viewing a dashboard, the following options are available:
 |
Switch to the dashboard editing mode. The editing mode is also opened when a new dashboard is being created and when you click on the  edit button of a widget. edit button of a widget. |
|
 |
Open the action menu (see action descriptions below). | |
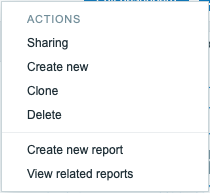 |
Sharing - edit sharing preferences for the dashboard. Dashboards can be made public or private. Public dashboards are visible to all users. Private dashboards are visible only to their owner. Private dashboards can be shared by the owner with other users and user groups. For details on configuring sharing, see the map configuration section. Create new - create a new dashboard. Clone - create a new dashboard by copying properties of the existing one. First you are prompted to enter dashboard parameters. Then, the new dashboard opens in editing mode with all the widgets of the original dashboard. Delete - delete the dashboard. Create new report - open a pop-up window with report configuration form. Disabled if the user does not have permission to manage scheduled reports. View related reports - open a pop-up window with a list of existing reports based on the current dashboard. Disabled if there are no related reports or the user does not have permission to view scheduled reports. |
|
 |
Display only page content (kiosk mode). Kiosk mode can also be accessed with the following URL parameters: /zabbix.php?action=dashboard.view&kiosk=1.To exit to normal mode: /zabbix.php?action=dashboard.view&kiosk=0 |
|
When editing a dashboard, the following options are available:
 |
Edit general dashboard parameters. | |
 |
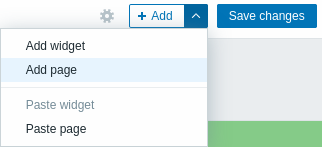
Add a new widget. Clicking on the arrow button will open the action menu (see action descriptions below). |
|
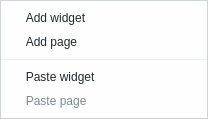 |
Add widget - add a new widget Add page - add a new page Paste widget - paste a copied widget. This option is grayed out if no widget has been copied. Only one entity (widget or page) can be copied at one time. Paste page - paste a copied page. This option is grayed out if no page has been copied. |
|
 |
Save dashboard changes. | |
 |
Cancel dashboard changes. | |
Creating a dashboard
It is possible to create a new dashboard in two ways:
- Click on Create dashboard, when viewing all dashboards
- Select Create new from the action menu, when viewing a single dashboard
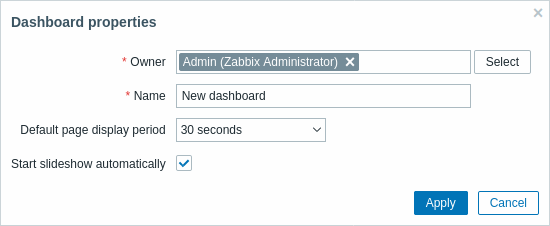
You will be first asked to enter general dashboard parameters:
| Parameter | Description |
|---|---|
| Owner | Select system user that will be the dashboard owner. |
| Name | Enter dashboard name. |
| Default page display period | Select period for how long a dashboard page is displayed before rotating to the next page in a slideshow. |
| Start slideshow automatically | Mark this checkbox to run a slideshow automatically one more than one dashboard page exists. |
When you click on Apply, an empty dashboard is opened:
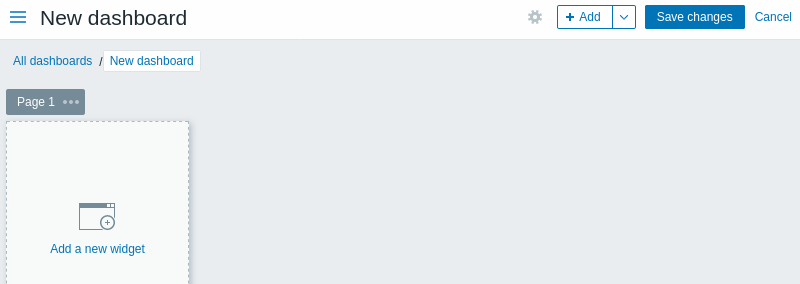
To populate the dashboard, you can add widgets and pages.
Click on the Save changes button to save the dashboard. If you click on Cancel, the dashboard will not be created.
Adding widgets
To add a widget to a dashboard:
- Click on the
button or the Add widget option in the action menu that can be
opened by clicking on the arrow. Fill the widget configuration form.
The widget will be created in its default size and placed after the
existing widgets (if any);
Or
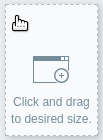
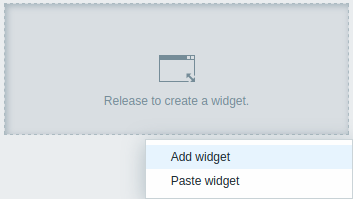
- Move your mouse to the desired empty spot for the new widget. Notice how a placeholder appears, on mouseover, on any empty slot on the dashboard. Then click to open the widget configuration form. After filling the form the widget will be created in its default size or, if its default size is bigger than is available, take up the available space. Alternatively, you may click and drag the placeholder to the desired widget size, then release, and then fill the widget configuration form. (Note that when there is a widget copied onto the clipboard, you will be first prompted to select between Add widget and Paste widget options to create a widget.)
In the widget configuration form:
- Select the Type of widget
- Enter widget parameters
- Click on Add
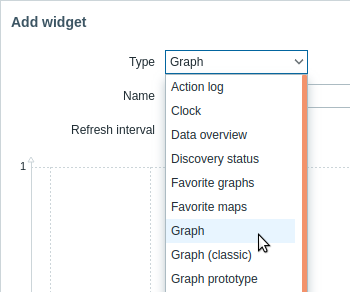
The following widgets can be added to a dashboard:
- Action log
- Clock
- Data overview
- Discovery status
- Favorite graphs
- Favorite maps
- Graph
- Graph (classic)
- Graph prototype
- Host availability
- Problem hosts
- Map
- Map navigation tree
- Plain text
- Problems
- System information
- Problems by severity
- Trigger overview
- URL
- Web monitoring
In dashboard editing mode widgets can be resized and moved around the dashboard by clicking on the widget title bar and dragging it to a new location. Also, you can click on the following buttons in the top-right corner of the widget to:
- -
edit a widget;
 -
access the widget menu
-
access the widget menu
Click on Save changes for the dashboard to make any changes to the widgets permanent.
Copying/pasting widgets
Dashboard widgets can be copied and pasted, allowing to create a new widget with the properties of an existing one. They can be copy-pasted within the same dashboard, or between dashboards opened in different tabs.
A widget can be copied using the widget menu. To paste the widget:
- click on the arrow next to the Add button and selecting the Paste widget option, when editing the dashboard
- use the Paste widget option when adding a new widget by selecting some area in the dashboard (a widget must be copied first for the paste option to become available)
A copied widget can be used to paste over an existing widget using the Paste option in the widget menu.
Creating a slideshow
A slideshow will run automatically if the dashboard contains two or more pages (see Adding pages) and if one of the following is true:
- The Start slideshow automatically option is marked in dashboard properties
- The dashboard URL contains a
slideshow=1parameter
The pages rotate according to the intervals given in the properties of the dashboard and individual pages. Click on:
- Stop slideshow - to stop the slideshow
- Start slideshow - to start the slideshow
Slideshow-related controls are also available in kiosk mode (where only the page content is shown):
 -
stop slideshow
-
stop slideshow -
start slideshow
-
start slideshow -
go back one page
-
go back one page -
go to the next page
-
go to the next page
Adding pages
To add a new page to a dashboard:
- Make sure the dashboard is in the editing mode
- Click on the arrow next to the Add button and select the Add page option
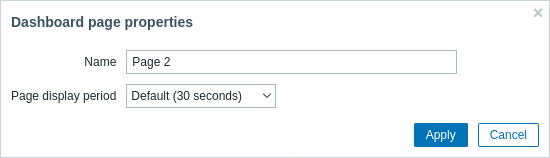
- Fill the general page parameters and click on Apply. If you leave
the name empty, the page will be added with a
Page Nname where 'N' is the incremental number of the page. The page display period allows to customize how long a page is displayed in a slideshow.
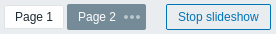
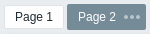
A new page will be added, indicated by a new tab (Page 2).
The pages can be reordered by dragging-and-dropping the page tabs. Reordering maintains the original page naming. It is always possible to go to each page by clicking on its tab.
When a new page is added, it is empty. You can add widgets to it as described above.
Copying/pasting pages
Dashboard pages can be copied and pasted, allowing to create a new page with the properties of an existing one. They can be pasted from the same dashboard or a different dashboard.
To paste an existing page to the dashboard, first copy it, using the page menu:
To paste the copied page:
- Make sure the dashboard is in the editing mode
- Click on the arrow next to the Add button and select the Paste page option
Page menu
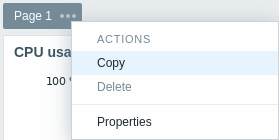
The page menu can be opened by clicking on the three dots
 next to the page name:
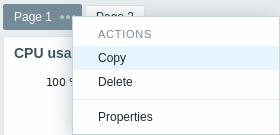
It contains the following options:
- Copy - copy the page
- Delete - delete the page (pages can only be deleted in the dashboard editing mode)
- Properties - customize the page parameters (the name and the page display period in a slideshow)
Widget menu
The widget menu contains different options based on whether the dashboard is in the edit or view mode:
| Widget menu | Options |
|---|---|
In dashboard edit mode: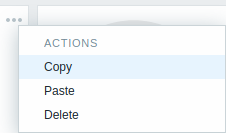 |
Copy - copy the widget Paste - paste a copied widget over this widget This option is grayed out if no widget has been copied. Delete - delete the widget |
In dashboard view mode: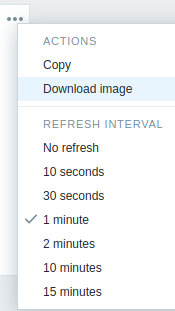 |
Copy - copy the widget Download image - download the widget as a PNG image (only available for graph/classic graph widgets) Refresh interval - select the frequency of refreshing the widget contents |
Dynamic widgets
When configuring some of the widgets:
- Graphs (simple and custom)
- Plain text
- URL
there is an extra option called Dynamic item. You can check this box to make the widget dynamic - i.e. capable of displaying different content based on the selected host.
Now, when saving the dashboard, you will notice that a new host selection field has appeared atop the dashboard for selecting the host (while the Select button allows selecting the host group in a popup):

Thus you have a widget, which can display content that is based on the data from the host that is selected. The benefit of this is that you do not need to create extra widgets just because, for example, you want to see the same graphs containing data from various hosts.
Permissions to dashboards
Permissions to dashboards for regular users and users of 'Admin' type are limited in the following way:
- They can see and clone a dashboard if they have at least READ rights to it;
- They can edit and delete dashboard only if they have READ/WRITE rights to it;
- They cannot change the dashboard owner.
Host menu
Clicking on a host in the Problems widget brings up the host menu. It includes links to host inventory, latest data, problems, graphs, dashboards, web scenarios and configuration. Note that host configuration is available for Admin and Superadmin users only.
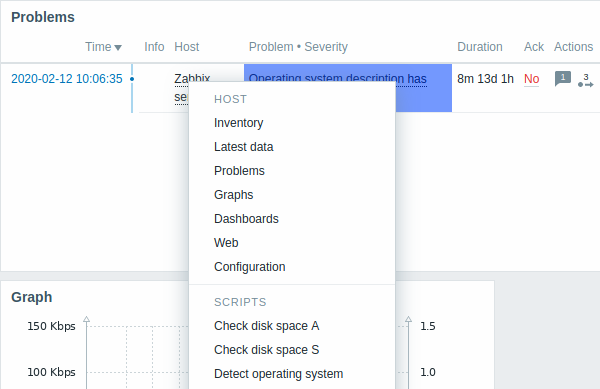
Global scripts can also be run from the host menu. These scripts need to have their scope defined as 'Manual host action' to be available in the host menu.
The host menu is accessible by clicking on a host in several other frontend sections:
- Monitoring → Problems
- Monitoring → Problems → Event details
- Monitoring → Hosts
- Monitoring → Hosts → Web Monitoring
- Monitoring → Overview (on Hosts: left)
- Monitoring → Latest data
- Monitoring → Maps
- Reports → Triggers top 100
Problem event popup
The problem event popup includes the list of problem events for this trigger and, if defined, the trigger description and a clickable URL.
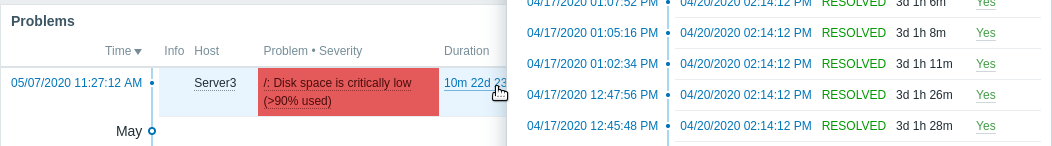
To bring up the problem event popup:
- roll a mouse over the problem duration in the Duration column of the Problems widget. The popup disappears once you remove the mouse from the duration.
- click on the duration in the Duration column of the Problems widget. The popup disappears only if you click on the duration again.
Resolved values of {ITEM.VALUE} and
{ITEM.LASTVALUE} macros in trigger descriptions are truncated to 20
characters. To see the entire values you may use macro
functions with these macros,
e.g. {{ITEM.VALUE}.regsub("(.*)", \1)},
{{ITEM.LASTVALUE}.regsub("(.*)", \1)} as a workaround.