
Nesta página
17 Prometheus checks
Overview
Zabbix can query metrics exposed in the Prometheus line format.
Two steps are required to start gathering Prometheus data:
- an HTTP master item pointing
to the appropriate data endpoint, e.g.
https://<prometheus host>/metrics - dependent items using a Prometheus preprocessing option to query required data from the metrics gathered by the master item
There are two Prometheus data preprocessing options:
- Prometheus pattern - used in normal items to query Prometheus data
- Prometheus to JSON - used in normal items and for low-level discovery. In this case queried Prometheus data are returned in a JSON format.
Configuration
Providing you have the HTTP master item configured, you need to create a dependent item that uses a Prometheus preprocessing step:
- Enter general dependent item parameters in the configuration form
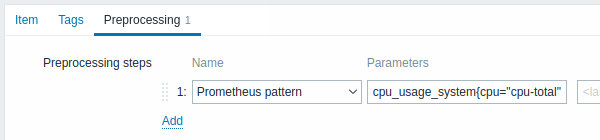
- Go to the Preprocessing tab
- Select a Prometheus preprocessing option (Prometheus pattern or Prometheus to JSON)
| Parameter | Description | Examples |
|---|---|---|
| Pattern | To define the required data pattern you may use a query language that is similar to Prometheus query language (see comparison table), e.g.: <metric name> - select by metric name {__name__="<metric name>"} - select by metric name {__name__=\~"<regex>"} - select by metric name matching a regular expression {<label name>="<label value>",...} - select by label name {<label name>=\~"<regex>",...} - select by label name matching a regular expression {__name__=\~".*"}==<value> - select by metric value Or a combination of the above: <metric name>{<label1 name>="<label1 value>",<label2 name>=\~"<regex>",...}==<value> Label value can be any sequence of UTF-8 characters, but the backslash, double-quote and line feed characters have to be escaped as \\, \" and \n respectively; other characters shall not be escaped. |
wmi_os_physical_memory_free_bytes cpu_usage_system{cpu="cpu-total"} cpu_usage_system{cpu=\~".*"} cpu_usage_system{cpu="cpu-total",host=\~".*"} wmi_service_state{name="dhcp"}==1 wmi_os_timezone{timezone=\~".*"}==1 |
| Output | Define label name (optional). In this case the value corresponding to the label name is returned. This field is only available for the Prometheus pattern option. |
|
Prometheus to JSON
Data from Prometheus can be used for low-level discovery. In this case data in JSON format are needed and the Prometheus to JSON preprocessing option will return exactly that.
For more details, see Discovery using Prometheus data.
Query language comparison
The following table lists differences and similarities between PromQL and Zabbix Prometheus preprocessing query language.
| PromQL instant vector selector | Zabbix Prometheus preprocessing | |
|---|---|---|
| Differences | ||
| Query target | Prometheus server | Plain text in Prometheus exposition format |
| Returns | Instant vector | Metric or label value (Prometheus pattern) Array of metrics for single value in JSON (Prometheus to JSON) |
| Label matching operators | =, !=, =\~, !\~ | =, =\~ |
| Regular expression used in label or metric name matching | RE2 | PCRE |
| Comparison operators | See list | Only == (equal) is supported for value filtering |
| Similarities | ||
| Selecting by metric name that equals string | <metric name> or {__name__="<metric name>"} | <metric name> or {__name__="<metric name>"} |
| Selecting by metric name that matches regular expression | {__name__=\~"<regex>"} | {__name__=\~"<regex>"} |
| Selecting by <label name> value that equals string | {<label name>="<label value>",...} | {<label name>="<label value>",...} |
| Selecting by <label name> value that matches regular expression | {<label name>=\~"<regex>",...} | {<label name>=\~"<regex>",...} |
| Selecting by value that equals string | {__name__=\~".*"} == <value> | {__name__=\~".*"} == <value> |