
2 Relatório de disponibilidade
Visão geral
Através deste módulo Relatórios → Relatório de disponibilidade você pode visualizar a proporção de tempo que cada trigger passou no estado de OK/INCIDENTE.
Assim, fica facil determinar a disponibilidade de vários elementos do seu ambiente.
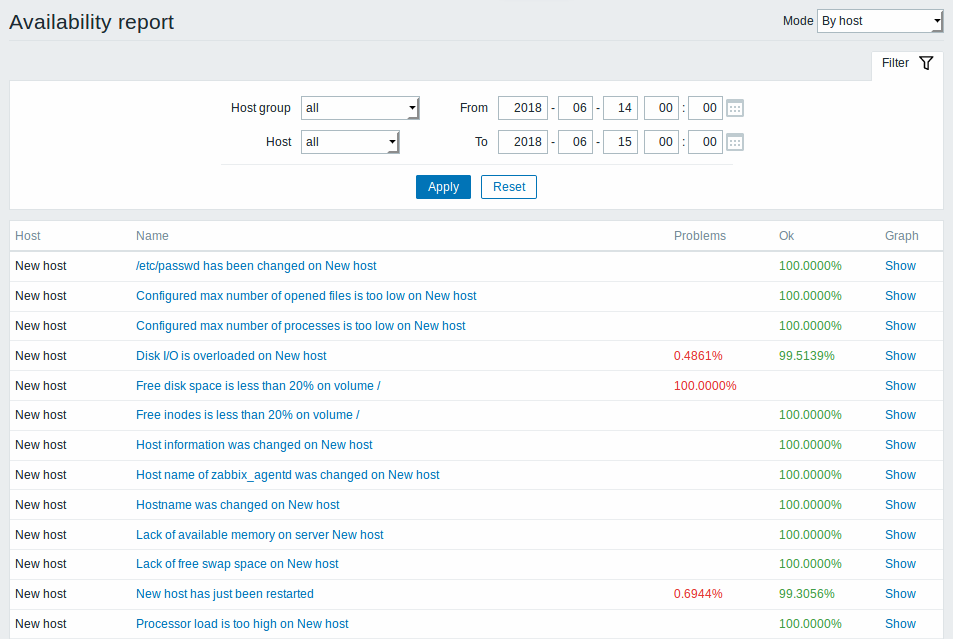
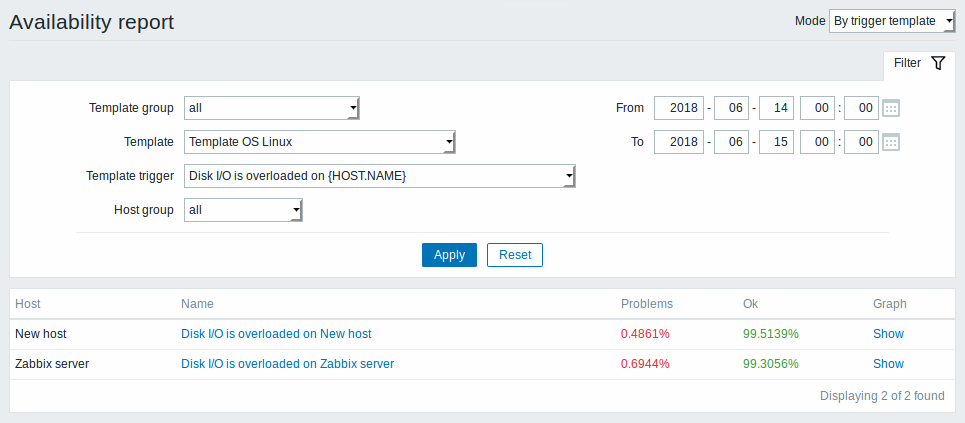
Na barra de título é possível selecionar o modo de exibição (por host ou por triggers de um template). Após isso utilize o filtro para restringir melhor o que deseja visualizar e o período.
O nome de cada trigger possui um link para os últimos eventos dela.
Clicando no link Mostrar na coluna Gráfico irá apresentar um gráfico de barra com a disponibilidade semanal no último ano.
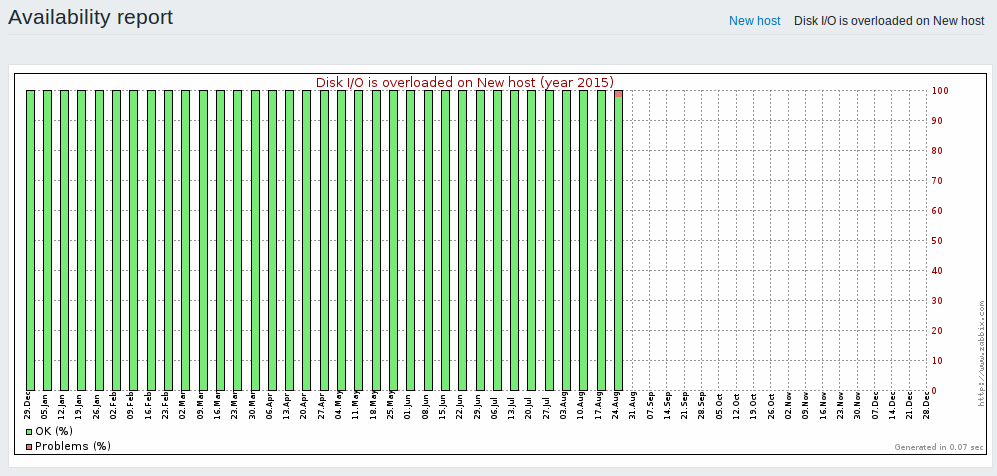
A parte verde das barras representa o estado OK e a vermelha o estado de INCIDENTE.
Using filter
The filter can help narrow down the number of hosts and/or triggers displayed. For better search performance, data is searched with macros unresolved.
The filter is located below the Availability report bar. It can be opened and collapsed by clicking on the Filter tab on the left.
Filtering by trigger template
In the by trigger template mode results can be filtered by one or several parameters listed below.
| Parameter | Description |
|---|---|
| Template group | Select all hosts with triggers from templates belonging to that group. Any host group that includes at least one template can be selected. |
| Template | Select hosts with triggers from the chosen template and all nested templates. Only triggers inherited from the selected template will be displayed. If a nested template has additional own triggers, those triggers will not be displayed. |
| //Template trigger // | Select hosts with chosen trigger. Other triggers of the selected hosts will not be displayed. |
| Host group | Select hosts belonging to the group. |
Filtering by host
In the by host mode results can be filtered by a host or by the host group. Specifying a parent host group implicitly selects all nested host groups.
Time period selector
The time period selector allows to select often required periods with one mouse click. The time period selector can be opened by clicking on the time period tab next to the filter.
Clicking on Show in the Graph column displays a bar graph where availability information is displayed in bar format each bar representing a past week of the current year.
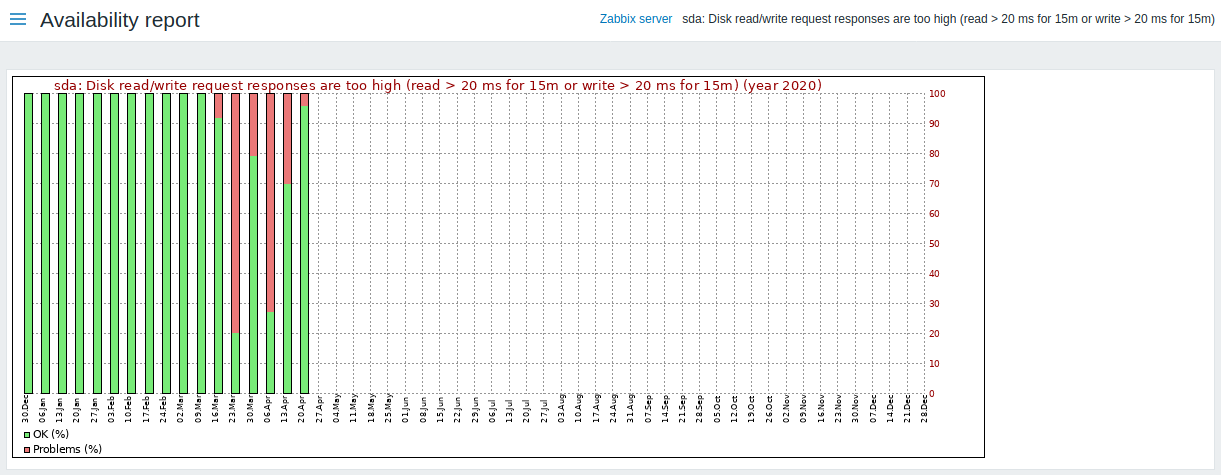
The green part of a bar stands for OK time and red for problem time.