
2 Visão geral
O módulo Monitoramento → Visão geral apresenta uma visão geral do status das triggers ou uma comparação de dados entre vários hosts de uma só vez.
Na barra de título da visão geral estão as opções de apresentação:
- Localização da informação dos hosts (vertical ou horizontal)
- Selecionar todos os hosts ou específicos
- Selecionar todas as aplicações ou aplicações específicas
- Selecionar o tipo de apresentação (dados ou triggers
Visão geral de triggers
A imagem a seguir apresenta exemplo da visão geral das triggers. São apresentados os estados das triggers (representado por suas cores) em cada host ao qual elas estão associadas:
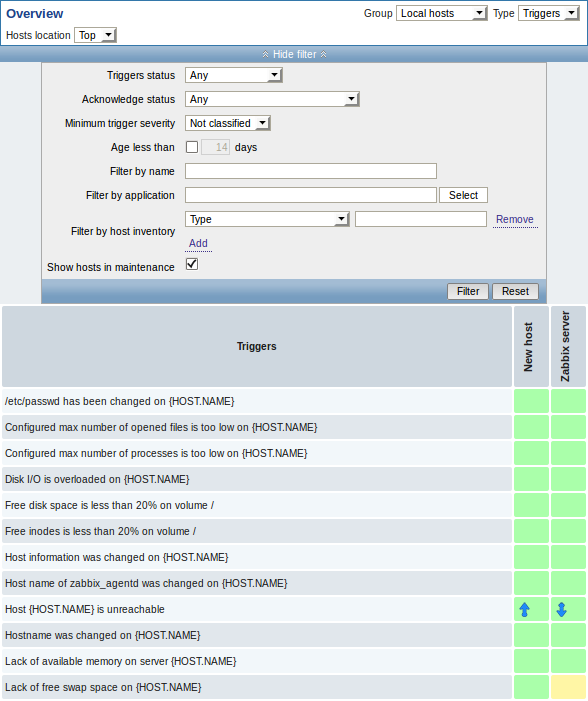
Observe que as triggers que tiveram modificações recentes (nos últimos 30 minutos) serão apresentadas como blocos piscantes.
Setas para cima e para baixo indicam que a trigger tem dependências, ao passar com o mouse por cima delas as dependências são apresentadas.
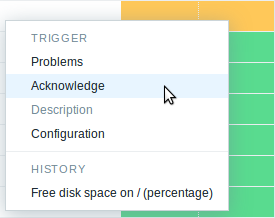
Ao clicar em um bloco de trigger é apresentado o menu flutuante de triggers com links relacionados.
Visão geral de dados
A imagem a seguir apresenta exemplo da visão geral de dados. São apresentados os dados de Performance (observe o filtro) de dois hosts.
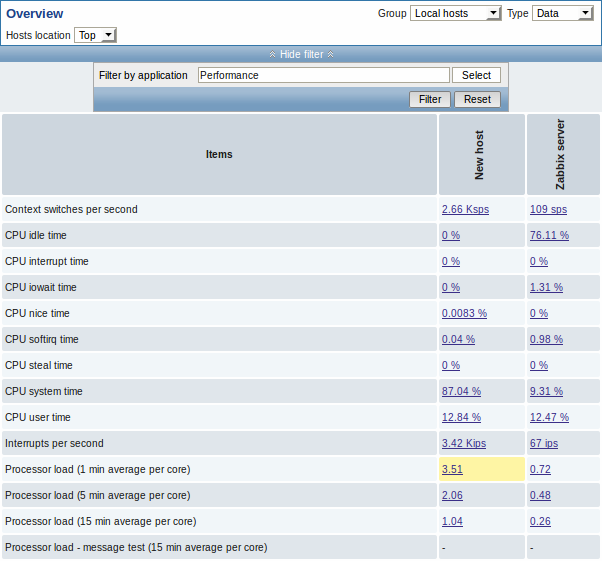
Apenas dados obtidos nas últimas 24 horas são apresentados por padrão, este limite foi introduzido para evitar problemas de performance ao buscar dados muito antigos. É possível modificar esta limitação ao modificar a constante ZBX_HISTORY_PERIOD no arquivo include/defines.inc.php.
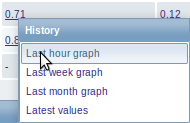
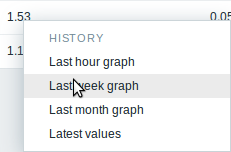
Clicando em um dado será apresentado um menu flutuante com links para gráficos pré-definidos ou dados recentes.
Overview
The Monitoring → Overview section may display either:
- Trigger overview - an overview of trigger states
- Data overview - a comparison of data for various hosts at once
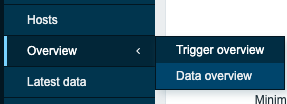
The list of available pages appears upon pressing on Overview in the Monitoring menu section. It is also possible to switch between pages by using a title dropdown in the top left corner.
 |
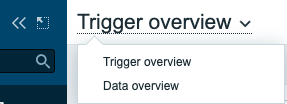 |
| Third-level menu. | Title dropdown. |
The following additional display options are available:
- select horizontal or vertical display of information in the Hosts location dropdown
Note that 50 records are displayed by default (configurable in Administration → General → GUI, using the Max number of columns and rows in overview tables option). If more records exist than are configured to display, a message is displayed at the bottom of the table, asking to provide more specific filtering criteria. There is no pagination.
Overview of triggers
In the next screenshot Trigger overview is selected. As a result, the trigger states of a local host are displayed as colored blocks (the color of problem triggers depends on the problem severity color, which can be adjusted in the problem update screen):
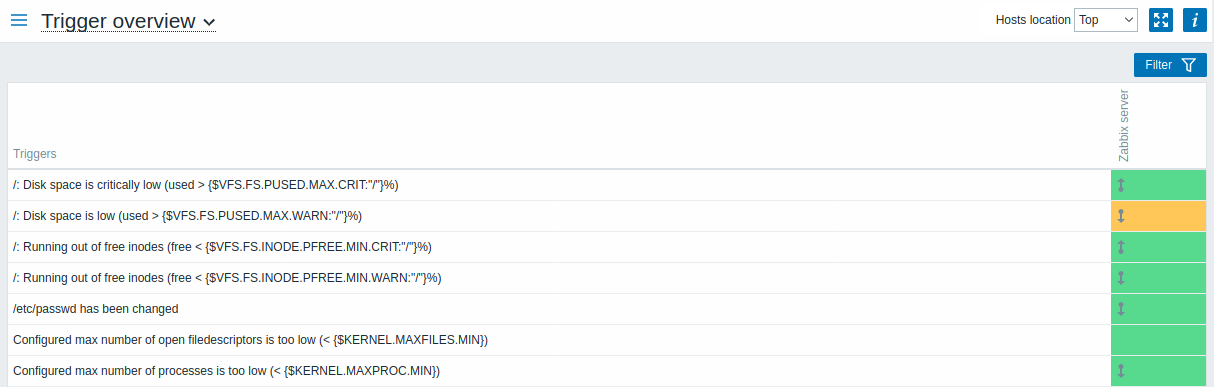
Note that recent trigger changes (within the last 2 minutes) will be displayed as blinking blocks.
Blue up and down arrows indicate triggers that have dependencies. On mouseover, dependency details are revealed.
A checkbox icon indicates acknowledged problems. All problems or resolved problems of the trigger must be acknowledged for this icon to be displayed.
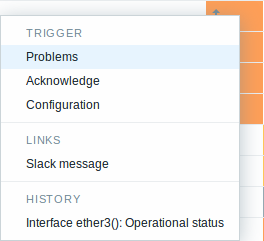
Clicking on a trigger block provides context-dependent links to problem events of the trigger, the problem acknowledgment screen, trigger configuration, trigger URL or a simple graph/latest values list.
Buttons
Button to the right offers the following option:
 |
Additional information on the page content is displayed if you roll the mouse over this button. |
View mode buttons being common for all sections are described on the Monitoring page.
Using filter
You can use the filter to display only the problems you are interested in. For better search performance, data is searched with macros unresolved.
The filter is located above the table.
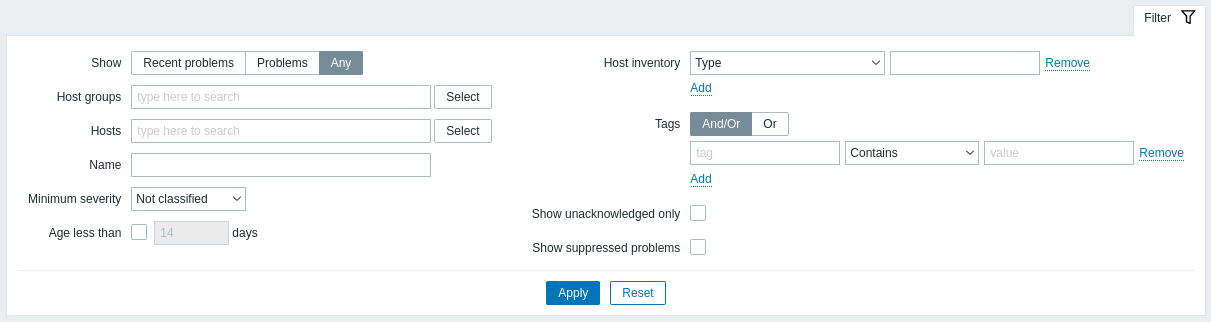
| Parameter | Description |
|---|---|
| Show | Filter by problem status: Recent problems - unresolved and recently resolved problems are displayed (default) Problems - unresolved problems are displayed Any - history of all events is displayed |
| Host groups | Filter by host group. |
| Hosts | Filter by host. |
| Name | Filter by problem name. |
| Minimum severity | Filter by minimum problem severity. |
| Age (less than) | Mark the checkbox to filter by problem age. |
| Host inventory | Filter by inventory type and value. |
| Tags | Specify tags to limit the number of problems displayed in the widget. It is possible to include as well as exclude specific tags and tag values. Several conditions can be set. Tag name matching is always case-sensitive. There are several operators available for each condition: Exists - include the specified tag names Equals - include the specified tag names and values (case-sensitive) Contains - include the specified tag names where the tag values contain the entered string (substring match, case-insensitive) Does not exist - exclude the specified tag names Does not equal - exclude the specified tag names and values (case-sensitive) Does not contain - exclude the specified tag names where the tag values contain the entered string (substring match, case-insensitive) There are two calculation types for conditions: And/Or - all conditions must be met, conditions having the same tag name will be grouped by the Or condition Or - enough if one condition is met |
| Show unacknowledged only | Mark the checkbox to only display problems which are unacknowledged. |
| Show suppressed problems | Mark the checkbox to display problems which would otherwise be suppressed (not shown) because of host maintenance. |
Overview of data
In the next screenshot Data overview is selected. As a result, item data of a local host is displayed.
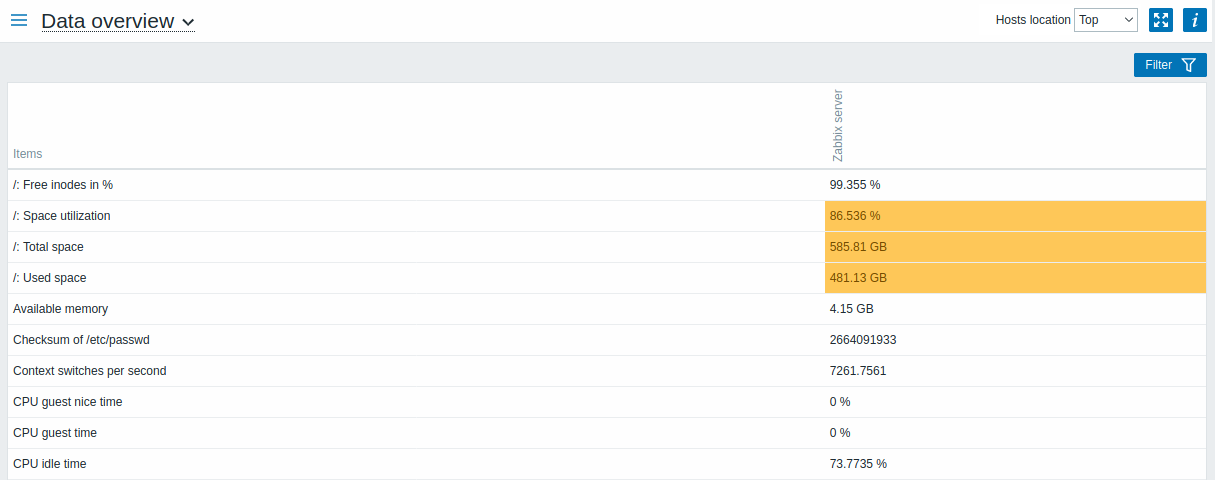
The color of problem items is based on the problem severity color, which can be adjusted in the problem update screen.
By default, only values that fall within the last 24 hours are displayed. This limit has been introduced with the aim of improving initial loading times for large pages of latest data. You can extend this time period by changing the value of Max history display period parameter in the Administration→General menu section.
Clicking on a piece of data offers links to some predefined graphs or latest values.
Using filter
You can use the filter to display only the data you are interested in. For better search performance, data is searched with macros unresolved.
The filter is located above the table.
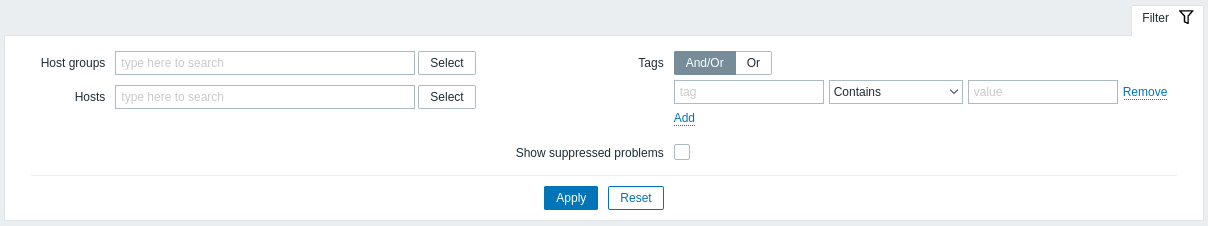
| Parameter | Description |
|---|---|
| Host groups | Filter by host group. |
| Hosts | Filter by host. |
| Tags | Specify item tags to limit the number of items displayed in the widget. It is possible to include as well as exclude specific tags and tag values. Several conditions can be set. Tag name matching is always case-sensitive. There are several operators available for each condition: Exists - include the specified tag names Equals - include the specified tag names and values (case-sensitive) Contains - include the specified tag names where the tag values contain the entered string (substring match, case-insensitive) Does not exist - exclude the specified tag names Does not equal - exclude the specified tag names and values (case-sensitive) Does not contain - exclude the specified tag names where the tag values contain the entered string (substring match, case-insensitive) There are two calculation types for conditions: And/Or - all conditions must be met, conditions having the same tag name will be grouped by the Or condition Or - enough if one condition is met |
| Show suppressed problems | Mark the checkbox to display problems which would otherwise be suppressed (not shown) because of host maintenance. |