
5 Monitor VMware with Zabbix
Introduction
This page walks you through the steps required to start basic monitoring of VMware.
Who this guide is for
This guide is designed for new Zabbix users and contains the minimum set of steps required to enable basic monitoring of VMware. If you are looking for deep customization options or require more advanced configuration, see the Virtual machine monitoring section or the Configuration section of Zabbix manual.
Prerequisites
Before proceeding with this guide, you need to download and install Zabbix server and Zabbix frontend according to the instructions for your OS.
This guide is based on the following setup:
- Zabbix version: 6.4 (installed from packages)
- OS distribution: Ubuntu
- OS version: 22.04 (Jammy)
- Zabbix components: Server, Frontend, Agent
- Database: MySQL
- Web server: Apache
It is assumed that VMware is already configured. This guide does not cover the configuration of VMware.
Configure Zabbix server
To monitor VMware, the vmware collector Zabbix processes need to be enabled. For more information on how VMware monitoring is performed, see Virtual machine monitoring.
1. Open the Zabbix server configuration file.
vi /etc/zabbix/zabbix_server.conf2. Locate and set the StartVMwareCollectors parameter in Zabbix server configuration file to 2 or more (the default value is 0).
### Option: StartVMwareCollectors
#       Number of pre-forked vmware collector instances.
#
# Mandatory: no
# Range: 0-250
# Default:
# StartVMwareCollectors=0

StartVMwareCollectors=2
3. Restart Zabbix server.
systemctl restart zabbix-serverOnce the vmware collector processes have been started, move on to the next step.
Configure Zabbix frontend
1. Log into Zabbix frontend.
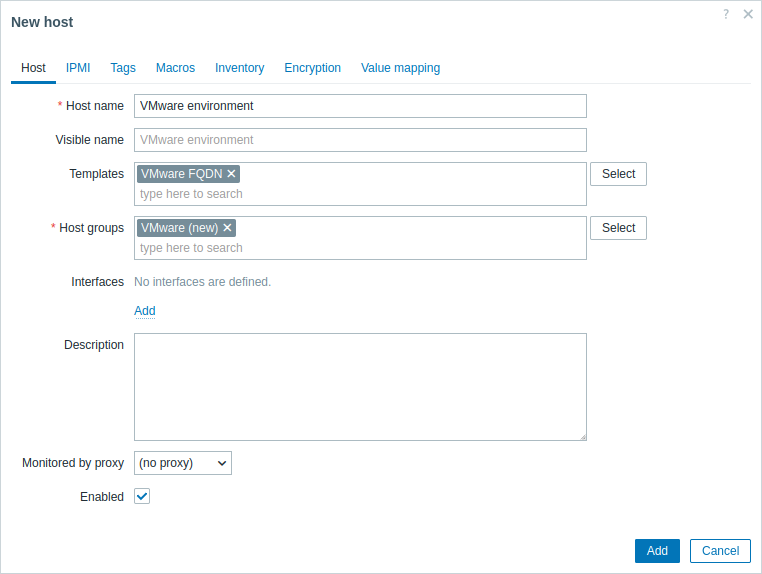
2. Create a host in Zabbix web interface:
- In the Host name field, enter a host name (for example, "VMware environment").
- In the Templates field, type or select the "VMware FQDN" (or "VMware") template. For more information on these templates, see Virtual machine monitoring.
- In the Host groups field, type or select a host group (for example, a new host group "VMware").
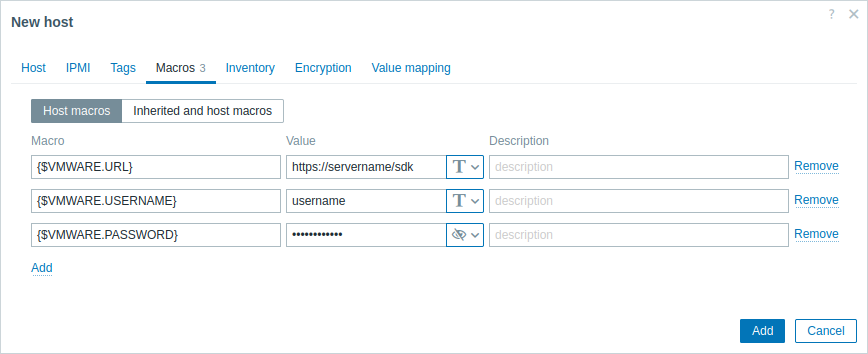
- In the Macros tab, set the following host macros:
- {$VMWARE.URL} - VMware service (vCenter or ESXi hypervisor) SDK URL (https://servername/sdk)
- {$VMWARE.USERNAME} - VMware service user name
- {$VMWARE.PASSWORD} - VMware service {$VMWARE.USERNAME} user password
3. Click the Add button to create the host. This host will represent your VMware environment.
View collected metrics
Congratulations! At this point, Zabbix is already monitoring your VMware environment.
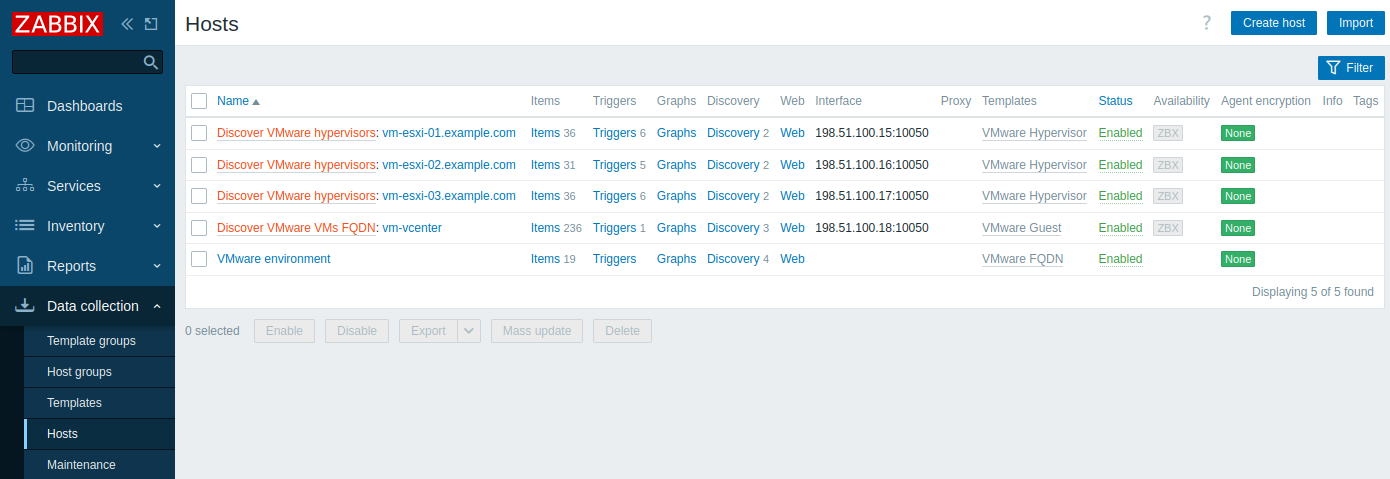
Depending on the configuration of your VMware environment, Zabbix may discover and then create hosts for the discovered entities. Note that the discovery and creation of hosts can also be executed manually, if necessary.
To view created hosts, navigate to the Data collection → Hosts menu section.
To view collected metrics, navigate to the Monitoring → Hosts menu section and click Latest data next to the created "VMware environment" host or one of the hosts that were created for the discovered entities.
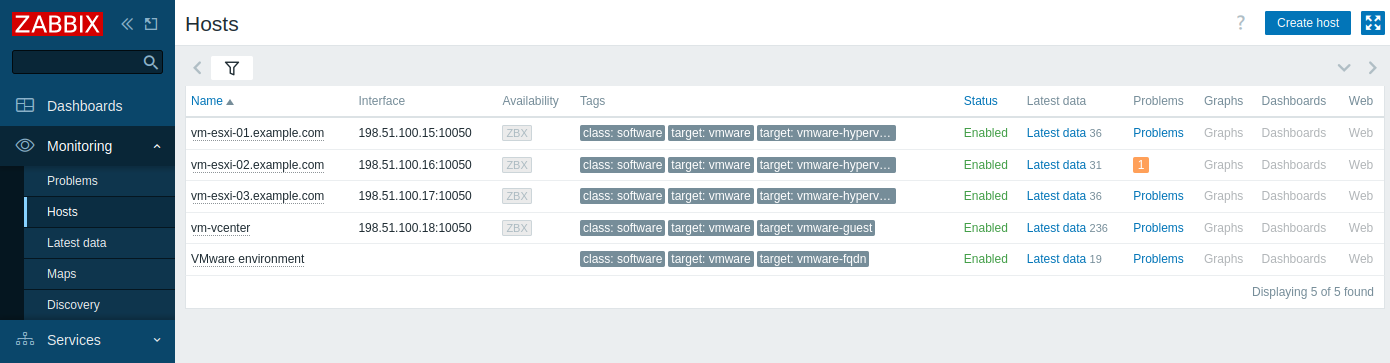
This action will open a list of all the latest metrics collected from the selected host.
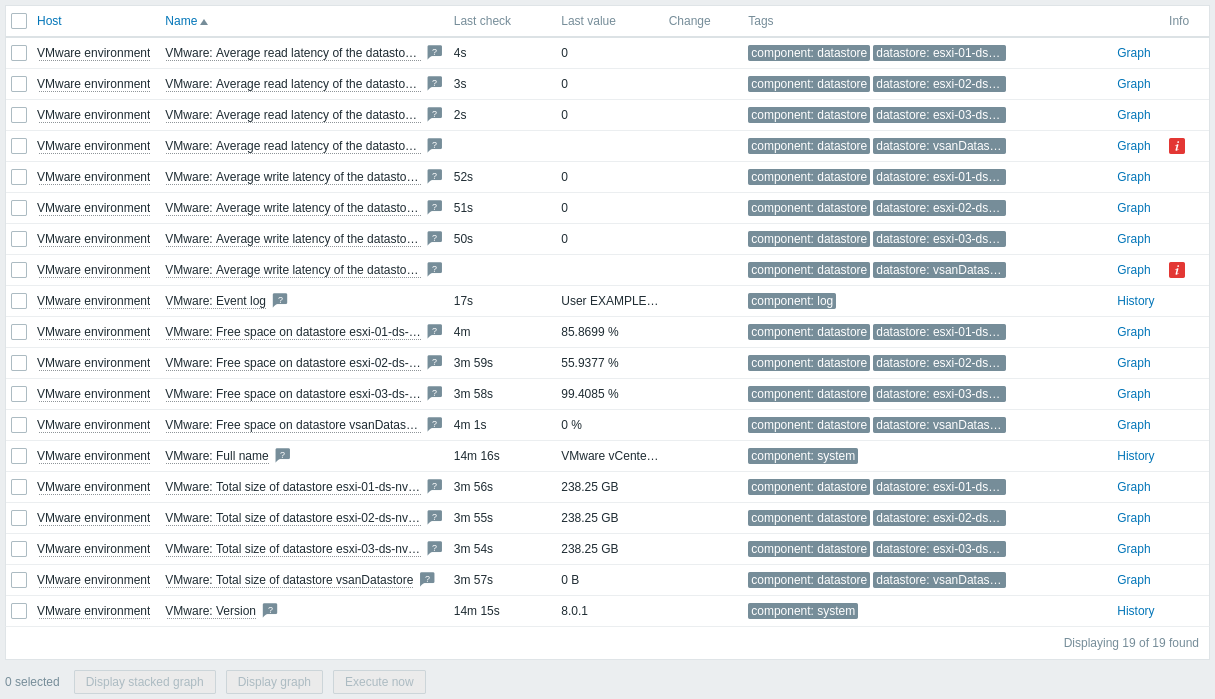
Note that some items have no data and the Not supported state. This is because Zabbix cannot find valid performance counters on the specific datastore, as it is not enabled in the VMware environment being monitored.
Set up problem alerts
Zabbix can notify you about a problem with your infrastructure using a variety of methods. This guide provides basic configuration steps for sending email alerts.
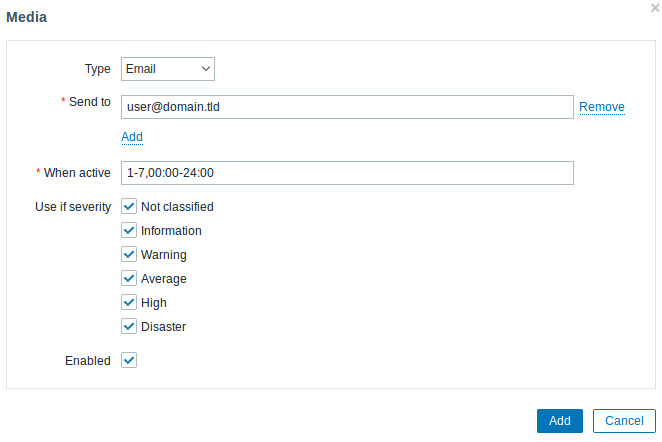
1. Navigate to User settings → Profile, switch to the Media tab and add your email.
2. Follow the guide for Receiving a problem notification.
Next time, when Zabbix detects a problem, you should receive an alert via email.
See also
- Creating an item - how to start monitoring additional metrics.
- Problem escalations - how to create multi-step alert scenarios (e.g., first send message to the system administrator, then, if a problem is not resolved in 45 minutes, send message to the data center manager).
- Virtual machine monitoring - additional information about VMware monitoring (data collection process, server configuration options, troubleshooting guidance, etc.).
- VMware monitoring item keys - a full list of VMware metrics that can be monitored using Zabbix.
- Template VMware - additional information about the VMware template.
- Template VMware FQDN - additional information about the VMware FQDN template.