
3 概述
简介
在 监测→ 概述 提供了总览触发器状态一个平台,或者将不同主机的数据放在一起进行比较。 可用下列显示的选项:
- 在主机群组下拉菜单中选择全部或指定主机群组
- 在类型下拉菜单中选择要显示的信息类型(触发器或数据)
- 在主机位置下拉菜单中选择主机名位于表格顶端或表格左侧显示
触发器概述
在下一个屏幕截图中,在类型下拉列表中选择触发器。 因此,两个本地主机的触发状态显示为彩色块,(问题触发器的颜色取决于问题严重性颜色,可以在 确认问题 屏幕中调整):
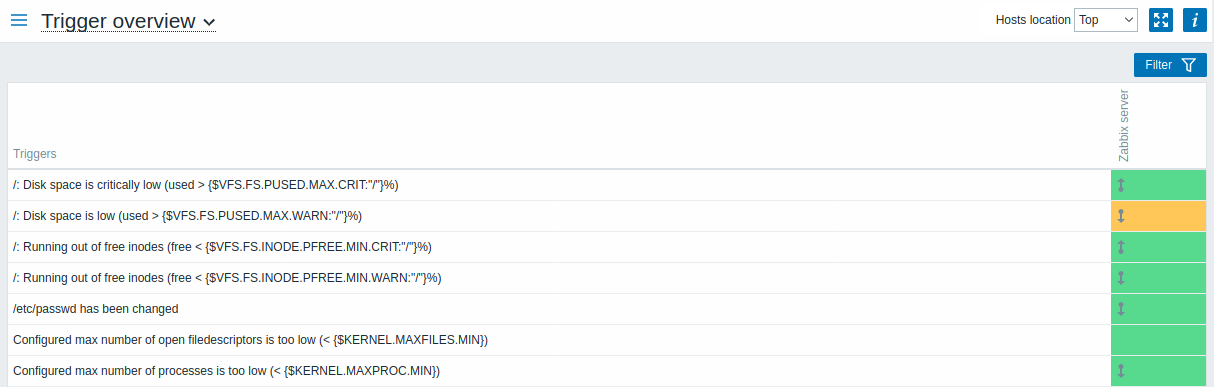
请注意。显示为闪烁块,仅显示(最后2分钟内)变化的触发器。
蓝色向上和向下箭头表示具有依赖关系的触发器。 在鼠标悬停时,显示依赖性详细信息。
复选框图标表示已确认的问题。
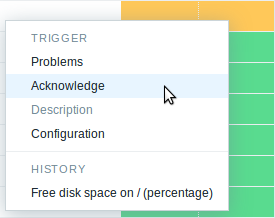
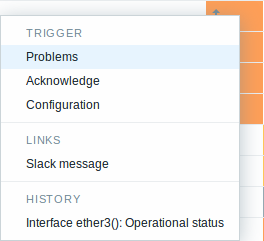
单击触发器块可提供与触发器的问题事件,问题确认屏幕,触发器配置,触发器URL或简单图表/最新值列表的上下文相关链接。
数据概述
在下一个屏幕截图中,在类型下拉列表中选择数据。 结果为显示两个本地主机的性能项数据。
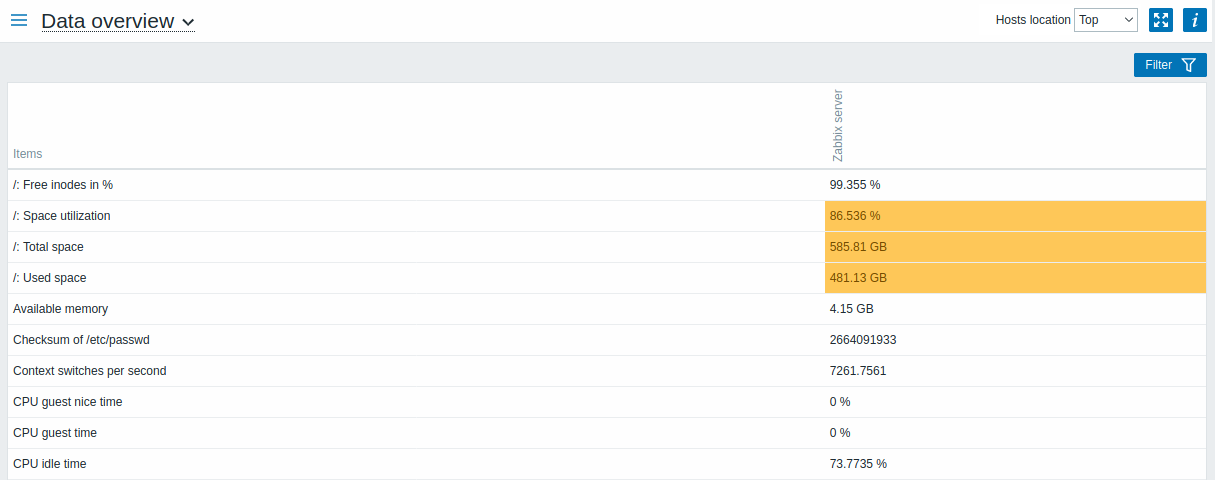
问题项的颜色基于问题严重性颜色,可以在 问题确认 中调整.
默认情况下仅显示最近24小时内的数据。这样设置是为了优化页面加载数据的时间。 如果你想查看更多数据也可以到前端文件include/defines.inc.php 中更改 ZBX_HISTORY_PERIOD的常量值 。
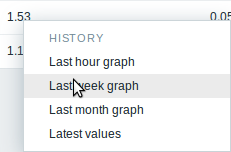
单击一条数据可提供指向某些预定义图形或最新值的链接。
Overview of triggers
In the next screenshot Trigger overview is selected. As a result, the trigger states of a local host are displayed as colored blocks (the color of problem triggers depends on the problem severity color, which can be adjusted in the problem update screen):
Note that recent trigger changes (within the last 2 minutes) will be displayed as blinking blocks.
Blue up and down arrows indicate triggers that have dependencies. On mouseover, dependency details are revealed.
A checkbox icon indicates acknowledged problems. All problems or resolved problems of the trigger must be acknowledged for this icon to be displayed.
Clicking on a trigger block provides context-dependent links to problem events of the trigger, the problem acknowledgment screen, trigger configuration, trigger URL or a simple graph/latest values list.
Buttons
Button to the right offers the following option:
 |
Additional information on the page content is displayed if you roll the mouse over this button. |
View mode buttons being common for all sections are described on the Monitoring page.
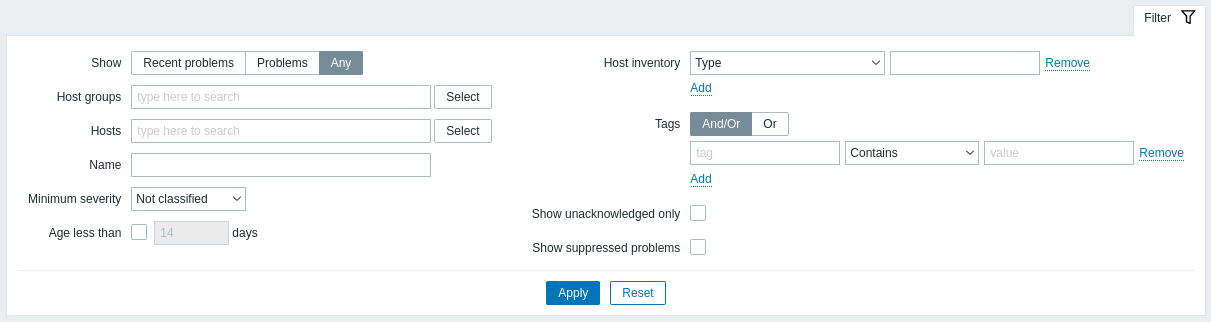
Using filter
You can use the filter to display only the problems you are interested in. For better search performance, data is searched with macros unresolved.
The filter is located above the table.
| Parameter | Description |
|---|---|
| Show | Filter by problem status: Recent problems - unresolved and recently resolved problems are displayed (default) Problems - unresolved problems are displayed Any - history of all events is displayed |
| Host groups | Filter by host group. |
| Hosts | Filter by host. |
| Name | Filter by problem name. |
| Minimum severity | Filter by minimum problem severity. |
| Age (less than) | Mark the checkbox to filter by problem age. |
| Host inventory | Filter by inventory type and value. |
| Tags | Specify tags to limit the number of problems displayed in the widget. It is possible to include as well as exclude specific tags and tag values. Several conditions can be set. Tag name matching is always case-sensitive. There are several operators available for each condition: Exists - include the specified tag names Equals - include the specified tag names and values (case-sensitive) Contains - include the specified tag names where the tag values contain the entered string (substring match, case-insensitive) Does not exist - exclude the specified tag names Does not equal - exclude the specified tag names and values (case-sensitive) Does not contain - exclude the specified tag names where the tag values contain the entered string (substring match, case-insensitive) There are two calculation types for conditions: And/Or - all conditions must be met, conditions having the same tag name will be grouped by the Or condition Or - enough if one condition is met |
| Show unacknowledged only | Mark the checkbox to only display problems which are unacknowledged. |
| Show suppressed problems | Mark the checkbox to display problems which would otherwise be suppressed (not shown) because of host maintenance. |
Overview of data
In the next screenshot Data overview is selected. As a result, item data of a local host is displayed.
The color of problem items is based on the problem severity color, which can be adjusted in the problem update screen.
By default, only values that fall within the last 24 hours are displayed. This limit has been introduced with the aim of improving initial loading times for large pages of latest data. You can extend this time period by changing the value of Max history display period parameter in the Administration→General menu section.
Clicking on a piece of data offers links to some predefined graphs or latest values.
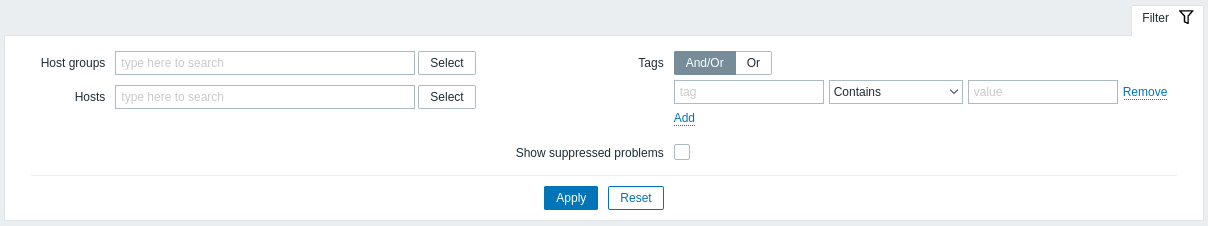
Using filter
You can use the filter to display only the data you are interested in. For better search performance, data is searched with macros unresolved.
The filter is located above the table.
| Parameter | Description |
|---|---|
| Host groups | Filter by host group. |
| Hosts | Filter by host. |
| Tags | Specify item tags to limit the number of items displayed in the widget. It is possible to include as well as exclude specific tags and tag values. Several conditions can be set. Tag name matching is always case-sensitive. There are several operators available for each condition: Exists - include the specified tag names Equals - include the specified tag names and values (case-sensitive) Contains - include the specified tag names where the tag values contain the entered string (substring match, case-insensitive) Does not exist - exclude the specified tag names Does not equal - exclude the specified tag names and values (case-sensitive) Does not contain - exclude the specified tag names where the tag values contain the entered string (substring match, case-insensitive) There are two calculation types for conditions: And/Or - all conditions must be met, conditions having the same tag name will be grouped by the Or condition Or - enough if one condition is met |
| Show suppressed problems | Mark the checkbox to display problems which would otherwise be suppressed (not shown) because of host maintenance. |