
- 5 What's new in Zabbix 5.2.0
- Trigger functions for long-term analytics
- New Script item type
- Time zone definition
- Storage of secrets
- User roles
- Active agent checks from multiple hosts
- Modbus support
- MQTT support
- Digest authentication for HTTP agent
- Template screens converted to dashboards
- Export to YAML
- Custom handling for item errors
- Host prototypes
- Agent configuration parameter for default search path
- SNMP item testing
- Refreshing unsupported items
- Macros
- Frontend
5 What's new in Zabbix 5.2.0
Trigger functions for long-term analytics
New trigger functions have been added allowing to compare data from absolute periods (hour, day, week, month, year) and notify user if there is a significant difference. The new functions are:
- trendavg - average of trend values for period
- trendcount - count of trend values for period
- trenddelta - delta of min/max trend values for period
- trendmax - maximum of trend values for period
- trendmin - minimum of trend values for period
- trendsum - sum of trend values for period
Note that the new functions return a result based on trend values, not history.
For example, you may want to know if there was a significant increase of server load last month (a 10% increase over the previous month):
{Server:system.cpu.load.trendavg(1M,now/M)}>1.1*{Server:system.cpu.load.trendavg(1M,now/M-1M)}You may also use the new "Event name" parameter in trigger configuration to build a meaningful alert message, for example to receive something like:
"Load of Exchange server increased by 24% in July (0.69) comparing to June (0.56)"
The new expression macros and new macro functions ('fmttime' and 'fmtnum') are used to build this message. For more details on configuring the event name, see a trigger configuration example.
See also:
New Script item type
A new Script item type has been introduced allowing to collect data by executing a user-defined JavaScript code with the ability to retrieve data over HTTP/HTTPS. This item type may be useful in data collection scenarios that require multiple steps or complex logic. As an example, a Script item can be configured to make an HTTP call, then process the data received in the first step in some way, and pass transformed value to the second HTTP call.
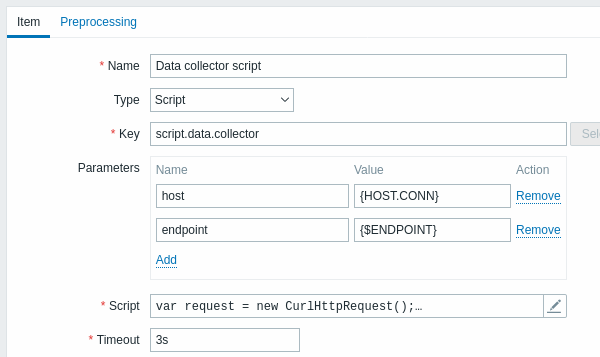
For more details see Script item type.
Time zone definition
The frontend time zone, previously set by the 'date.timezone' setting of php.ini, now can be set globally in the frontend and adjusted for individual users.
The default global time zone:
- can be set manually when installing the frontend
- can be modified in Administration → General → GUI
User-level time zone:
- can be set when configuring/updating a user
- can be set by each user in their user profile:
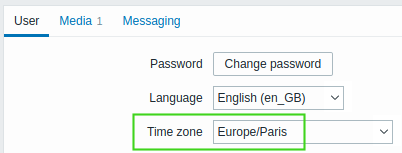
See also: Time zones
Storage of secrets
It is now possible to store some sensitive information from Zabbix secretly in HashiCorp Vault KV Secrets Engine - Version 2. Secrets can be saved for:
- user macro values
- database access credentials
Zabbix provides read-only access to the secrets in Vault.
See also: Storage of secrets
User roles
It is now possible to define user roles for granular control on what parts of UI, which API methods, and which functionality (such as the ability to acknowledge problems) are available to end-users.
Active agent checks from multiple hosts
Active agent checks can now be requested from multiple Zabbix hosts, by specifying these hosts in the Hostname agent parameter as a comma-delimited list. This is useful, for example, when several Zabbix hosts exist for one physical host.
Hostname=Host1, Host2, Host3Note that if several host names are specified in the Hostname parameter, active agent autoregistration will also create all of these hosts. In network discovery, however, only the first host listed in the Hostname parameter will be considered.
The same changes also apply to the content returned by the Hostnameitem parameter.
Modbus support
Zabbix now supports Modbus out-of-the-box using the new modbus.get[] agent and agent 2 item.
See also:
- Zabbix agent item keys
- Zabbix agent 2 plugins
- Modbus plugin documentation
MQTT support
Zabbix now supports receiving values of MQTT topics using the new mqtt.get[] agent 2 item.
See also:
- Zabbix agent 2 item keys
- Zabbix agent 2 plugins
- MQTT plugin documentation
Digest authentication for HTTP agent
Digest authentication is now supported for HTTP agent items and in web scenarios.
Template screens converted to dashboards
Host screens configured on the template level have been converted to host dashboards.
See also:
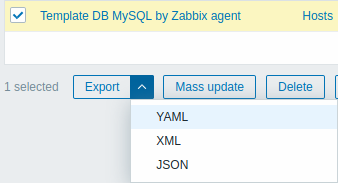
Export to YAML
Zabbix configuration elements now can also be exported and imported in the YAML format, which is easy to read and edit.
Custom handling for item errors
Custom handling for item errors has been introduced in the new version on the basis of an individual item. If previously any item error resulted in the item becoming unsupported, now it is possible to use a new preprocessing rule called "Check for not supported value" to handle this situation. This preprocessing rule has standard Custom on fail options allowing to:
- discard the value
- set new value (in this case the item becomes supported and the value can be used in triggers)
- set another error message
This preprocessing step can be used only once and it makes sense to have it as the first preprocessing step.
The main use cases for this functionality are as follows:
- you may want some items to never go unsupported, for example, in case of transient problems
- you may want to be notified when checking some service (HTML, for example) fails using standard trigger alerting functionality (this can be accomplished by setting the new value to something like '-1')
- you may want to use items as a kind of "ping" for availability of services, and be able to configure alerting if the service is not available
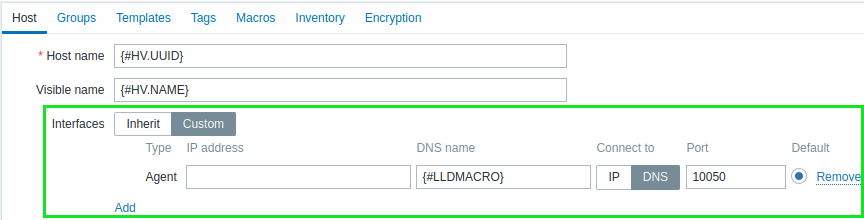
Host prototypes
Two new options can now be set on a host prototype level, making low-level discovery even more flexible.
Custom interfaces
Host prototype configuration form now allows to select with which interfaces a discovered host should be created:
- Inherit (default) - the hosts will be created with the interface of a host the Discovery rule belongs to. If a host prototype is configured on the template level, then discovered hosts will inherit the interface of a host to which the template is linked to.
- Custom - the hosts will be created with a specified interface (or several interfaces). All four interface types are supported: Zabbix agent, IPMI, JMX, SNMP. If Custom is set, but no interfaces have been specified - the hosts will be created without interfaces.
Tags
Additionally, support of tags with a possibility to use LLD macros as tag values has been added to the host prototypes. This functionality allows assigning each discovered host own set of tags with valuable information (datacenter, instance type, resource type, etc.), which can be useful, for example, in the discovery of cloud resources.
Agent configuration parameter for default search path
A new optional parameter UserParameterDir has been added to the
Zabbix agent and agent
2 configuration files. The
parameter specifies a custom directory to execute UserParameter commands
from. If UserParameterDir is present, the agent will change its working
directory to the one specified by this parameter before executing a
UserParameter command. Thereby UserParameter commands can have a
relative ./ prefix instead of a full path.
Example:
UserParameterDir=/opt/myscripts
UserParameter=check_cpu,./custom_script.sh
SNMP item testing
When testing SNMP items, it is now possible to specify version-specific details:
New fields in SNMPv2 item testing: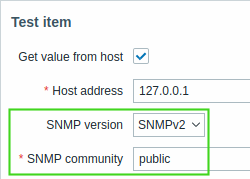 |
New fields in SNMPv3 item testing: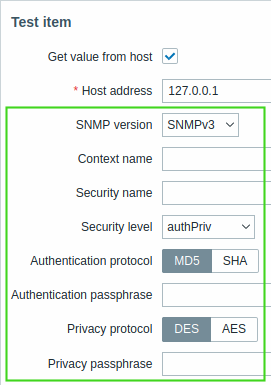 |
This is useful because, when testing SNMP items, problems are often associated with a wrong SNMPv2 community or SNMPv3 security credentials.
The values of these fields are pre-filled by the values of the corresponding SNMP interface as defined on the host. Note that if the field value is a macro with a text value, the field will be filled with the resolved macro value, however, if the value (or part of the value) is a secret or Vault macro, the field will be empty and will need to be filled manually. To be able to tell that a secret macro value is hidden, the following warning message will be displayed: "Item contains user-defined macros with secret values. Values of these macros should be entered manually."
SNMP items can be tested as an item, a low-level discovery rule and an item prototype. All these entities can be tested on template level as well.
Refreshing unsupported items
A separate setting for refreshing unsupported items has been removed from Administration → General → Other. Instead, the item update interval is now used for each unsupported item. This has been done to remove a potential performance bottleneck in the scenario when a lot of items turn unsupported and the global refresh interval has been set to a short value.
Macros
- {ITEM.LOG.*}
macros are now also
supported in:
- trigger names, operational data, URLs and descriptions;
- event tags and values.
- User macros are now supported in item and low-level discovery rule descriptions.
- User macro length limit has been increased from 255 to 2048 characters.
- New macros have been added:
- {ITEM.DESCRIPTION.ORIG<1-9>} resolves to the item description without macros expanded.
- {LLDRULE.DESCRIPTION.ORIG} resolves to the low-level discovery rule description without macros expanded.
Frontend
Minimum required PHP version
The minimum required PHP version has been upped from 7.2.0 to 7.2.5.
Informative tabs
Tabs in many frontend forms now indicate the number of defined elements or if the functionality is enabled. To illustrate let's compare a host configuration form with two linked templates, one host tag, one host-level macro, enabled inventory and two-way encryption enabled now and before:
| < | |||
|---|---|---|---|
| < | |||
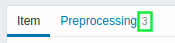
Informative tabs allow to debug problems easier, for example, when an item has preprocessing steps defined they are now clearly indicated with a number even when the tab is not opened:
Informative tabs have been added to the configuration forms for:
- Hosts and host prototypes
- Templates
- Items and item prototypes
- Triggers and trigger prototypes
- Discovery rules
- Web scenarios
- Actions
- Services
- Proxies
- Authentication
- Users and user groups
- Media types
- Graph widgets
- Maps
- User settings
Session stored in cookie
Zabbix session data is now stored in a user cookie.
Ability to change the default language
It is now possible to choose the default language for the Zabbix frontend during the installation process. After the installation, the system default language can be changed in the Administration→General→GUI section. If a user has not specified another language in the profile settings, the system-wide setting is used. Login page for all users is displayed in the chosen default language.
New configuration parameters
Several parameters, that previously could only be modified through
editing defines.inc.php file, can now be configured directly via the
frontend. This makes Zabbix frontend configuration more flexible and
ensures that custom changes will be preserved after an upgrade.
Administration → General frontend section has been modified to accommodate more parameters:
- General → GUI page now
- includes Working hours field (used to be on a separate page);
- contains new parameters: Max number of columns and rows in overview tables, Show technical errors, Max history display period, Default period (for graphs and dashboards), Max period (for graphs and dashboards).
- Working time page has been removed.
- Trigger severities page is moved to Trigger displaying options.
- Other page now includes three additional parameter groups:
- Authorization, which allows to set number of failed login attempts and period of blocking login page after exceeding this limit;
- Security, which allows to set URI scheme validation rules, X-Frame-Options HTTP header, and custom iframe sandboxing restrictions;
- Communication with Zabbix server, which allows to customize timeout limits.
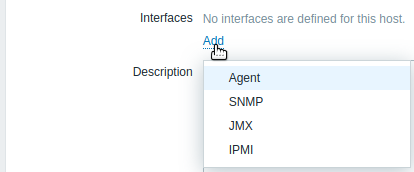
Adding hosts without interfaces
It is now possible to add a host without interfaces, which may be useful for hosts with only trapper items or web checks.
For a new host now no interfaces are defined by default. To add a new interface, click on Add in the Interfaces block and select the interface type from a dropdown.
Dashboard navigation and details
Switching to the required dashboard has become easier with these new features:
- List of all dashboards now has a filter, allowing to search for dashboards by name and to switch between displaying all dashboards and dashboards created by the current user.
- Dashboards created by the current user have a tag "My" next to a name
Additionally, it is now immediately visible, which dashboards are shared with other users. If a dashboard is public or is privately shared with any user or user group - a tag "Shared" next to the dashboard name will indicate that.
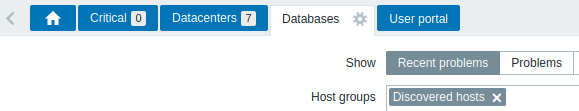
Tabs for favorite filters
In Monitoring→Hosts and Monitoring→Problems sections, it is now possible to save multiple filters and switch between saved sets of filter parameters in a single click, similar to the way of switching tabs in web browsers.
Simplified maintenance periods form
The Maintenance periods configuration form now has a simpler single-tab look. All configuration parameters previously located on the tabs Periods and Hosts and groups have been moved to the primary tab.
Miscellaneous
- A Timeout field has been added in the mass update for HTTP items.