
1 Graphs
Overview
Host graphs can be accessed from Monitoring → Hosts by clicking on Graphs for the respective host.
Any custom graph that has been configured for the host can be displayed, however, no more than 20 graphs can be displayed at one time.
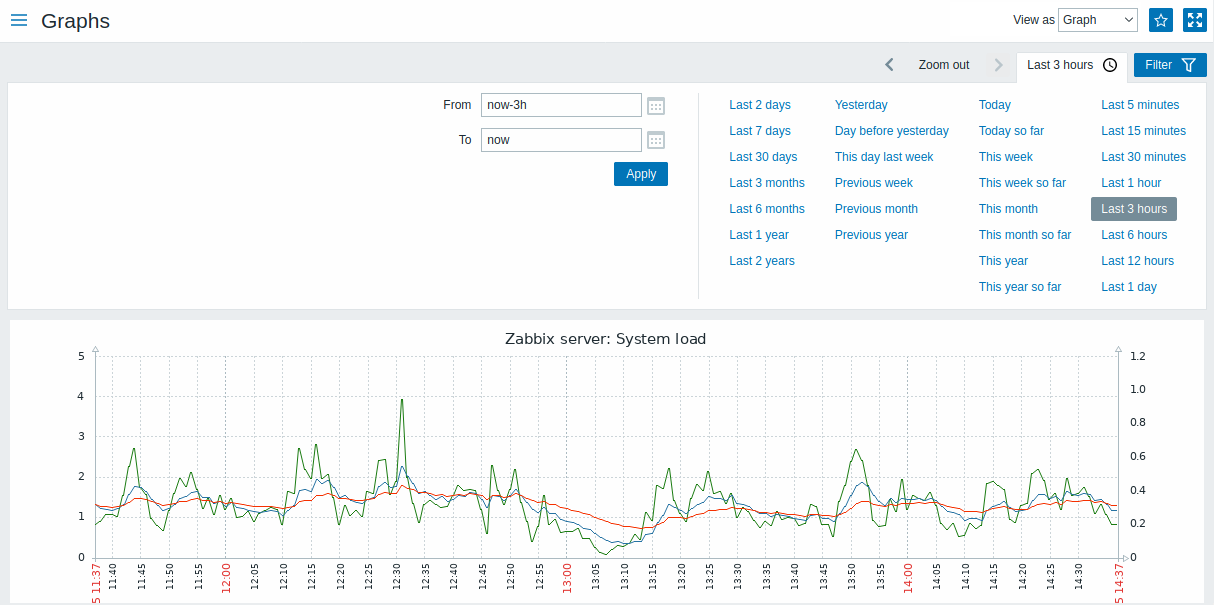
The View as option allows to view the data graphically or as values. Graphs for disabled hosts are also accessible.
Time period selector
Take note of the time period selector above the graph. It allows to select often required periods with one mouse click.
See also: Time period selector
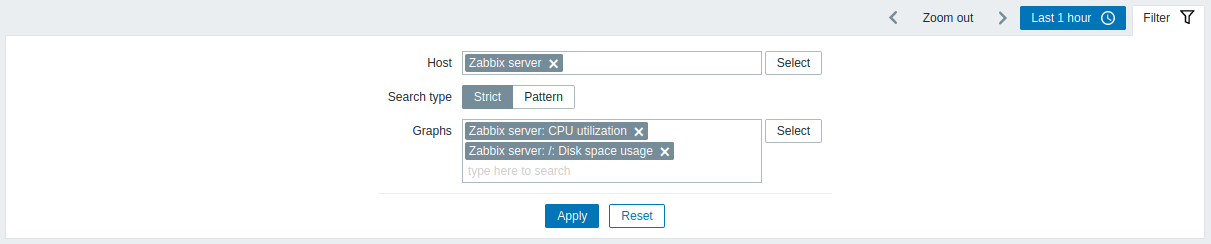
Using filter
To view a specific graph, select it in the filter. The filter allows to specify one host at a time (host is mandatory), and then specify host graphs either by selecting from the list or by searching by the graph name pattern.
Buttons
Buttons to the right offer the following options:
 |
Add graph to the favorites widget in the Dashboard. |
 |
The graph is in the favorites widget in the Dashboard. Click to remove graph from the favorites widget. |
View mode buttons being common for all sections are described on the Monitoring page.