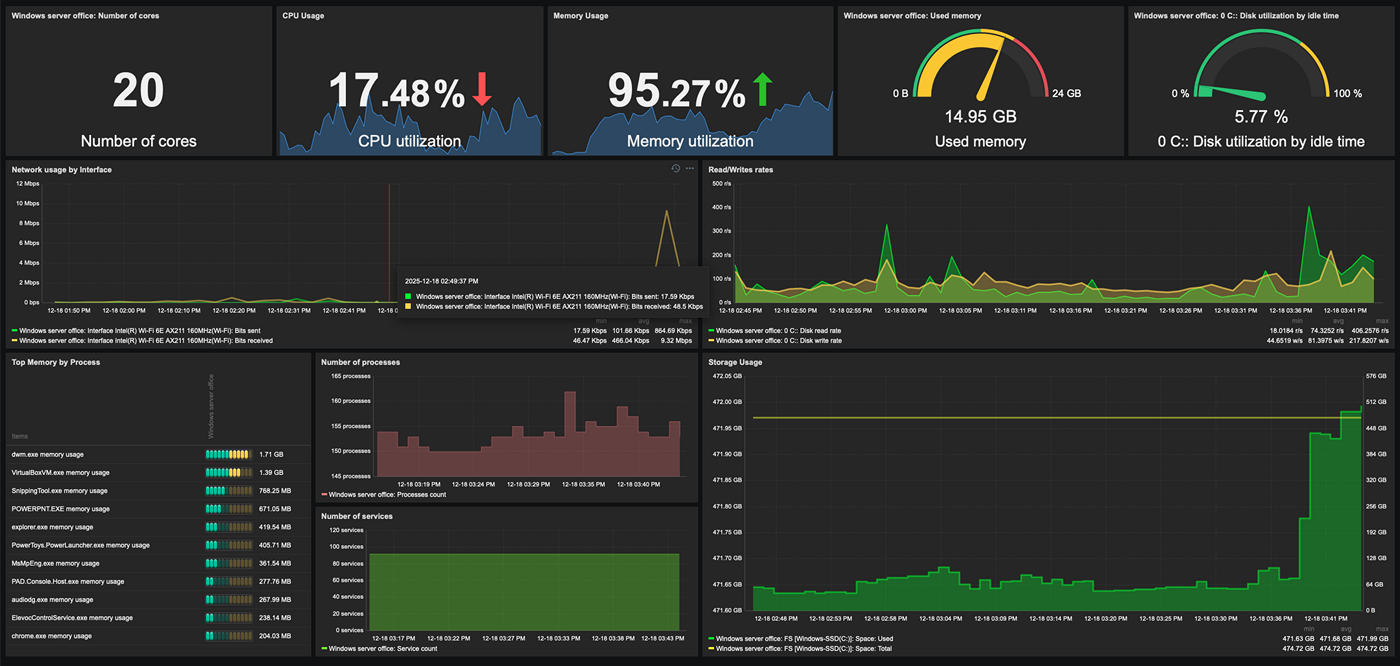
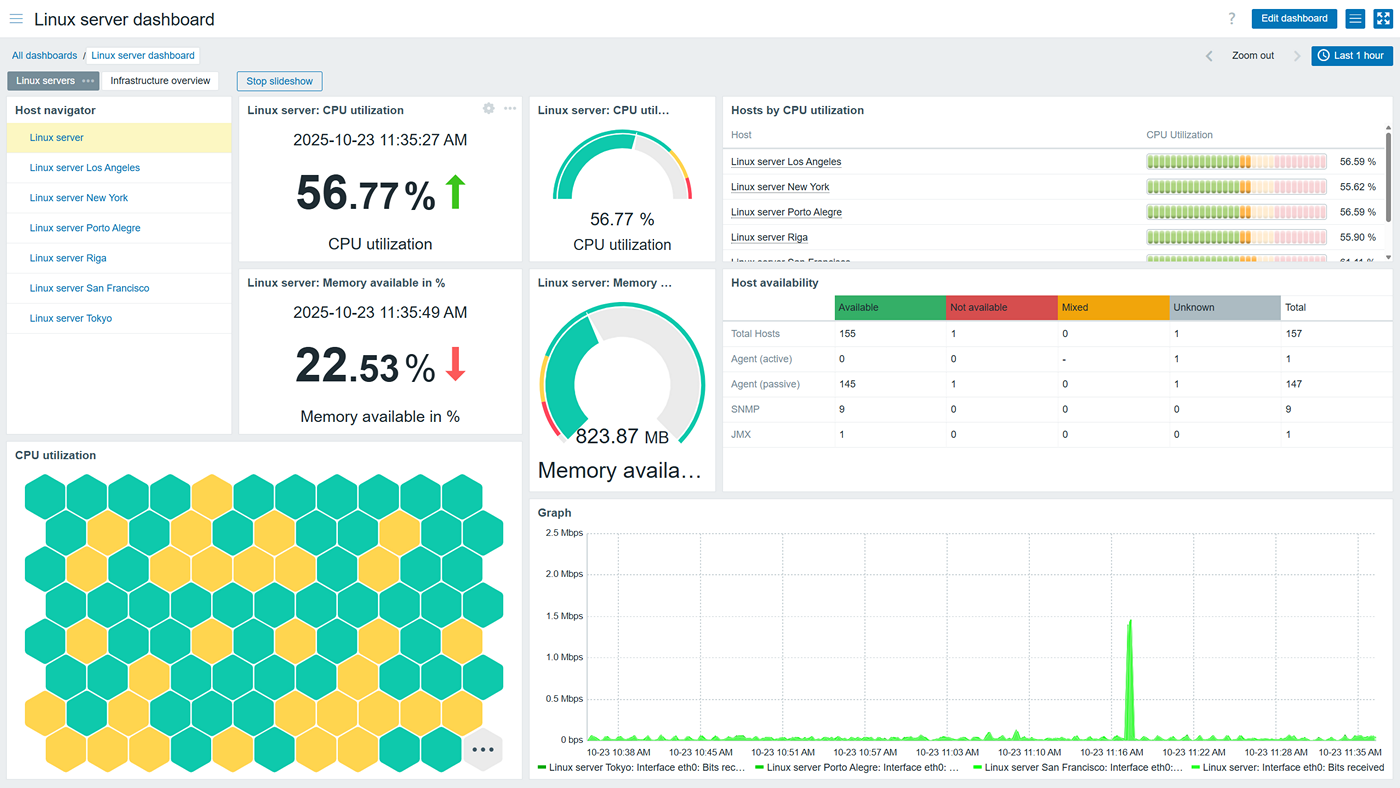
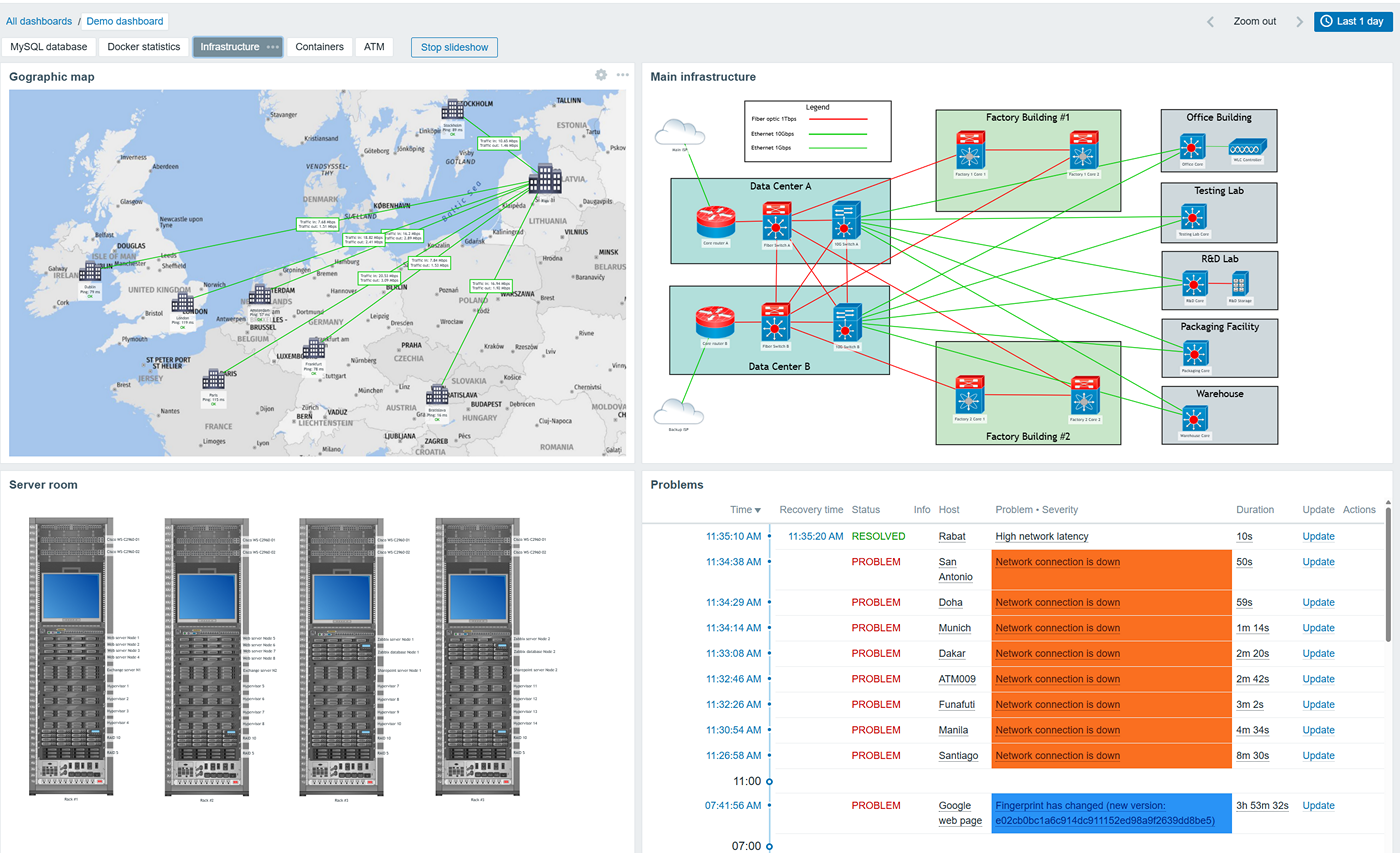
Monitor physical, virtual, container, and cloud infrastructures
Zabbix provides the tools to monitor any type of server
- Utilize a variety of supported technologies and protocols, such as SNMP, IPMI, SSH, HTTP, Zabbix agent checks, and more to monitor a variety of different server types
- Discover and start monitoring your Docker and Kubernetes resources, including containers, nodes, and pods
- Integrate Zabbix with your VMware infrastructures and automatically start monitoring your VMware guest machines, hypervisors, and datastores
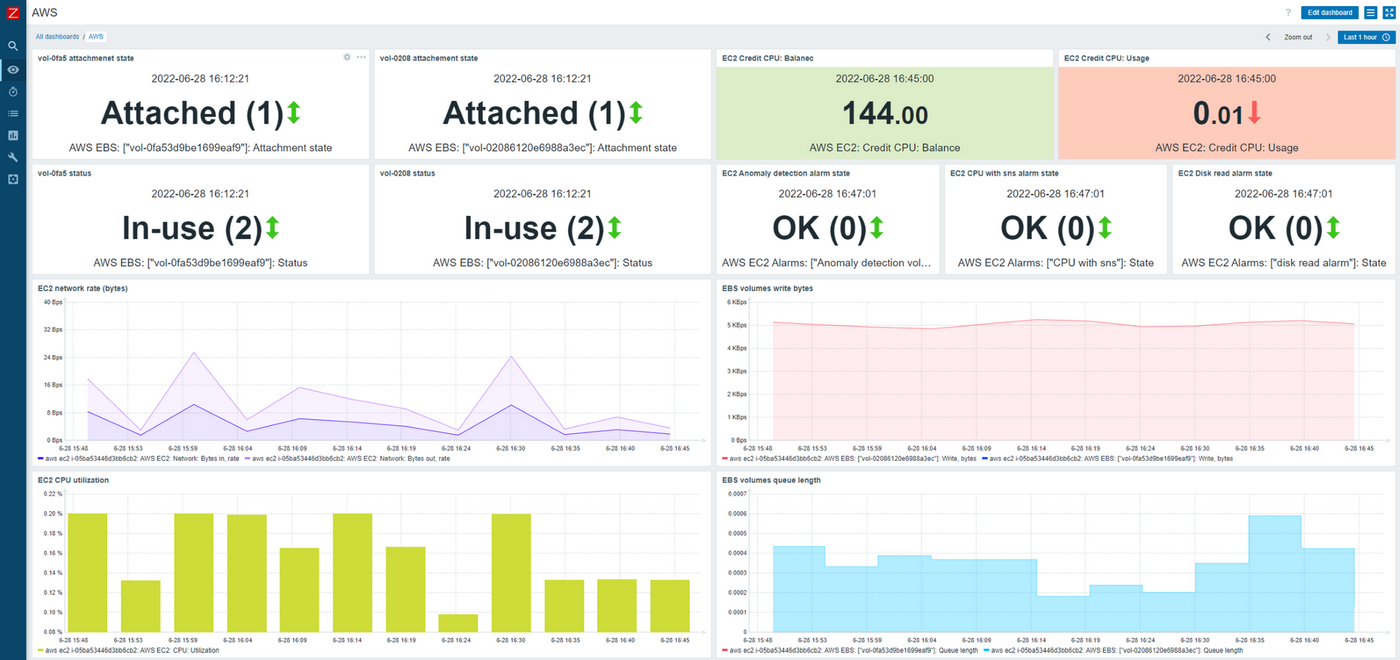
- Track your cloud infrastructures from vendors such as AWS, Azure, GCP, Oracle Cloud, and others
 Monitor physical, virtual, container, and cloud infrastructures
">
Monitor physical, virtual, container, and cloud infrastructures
">
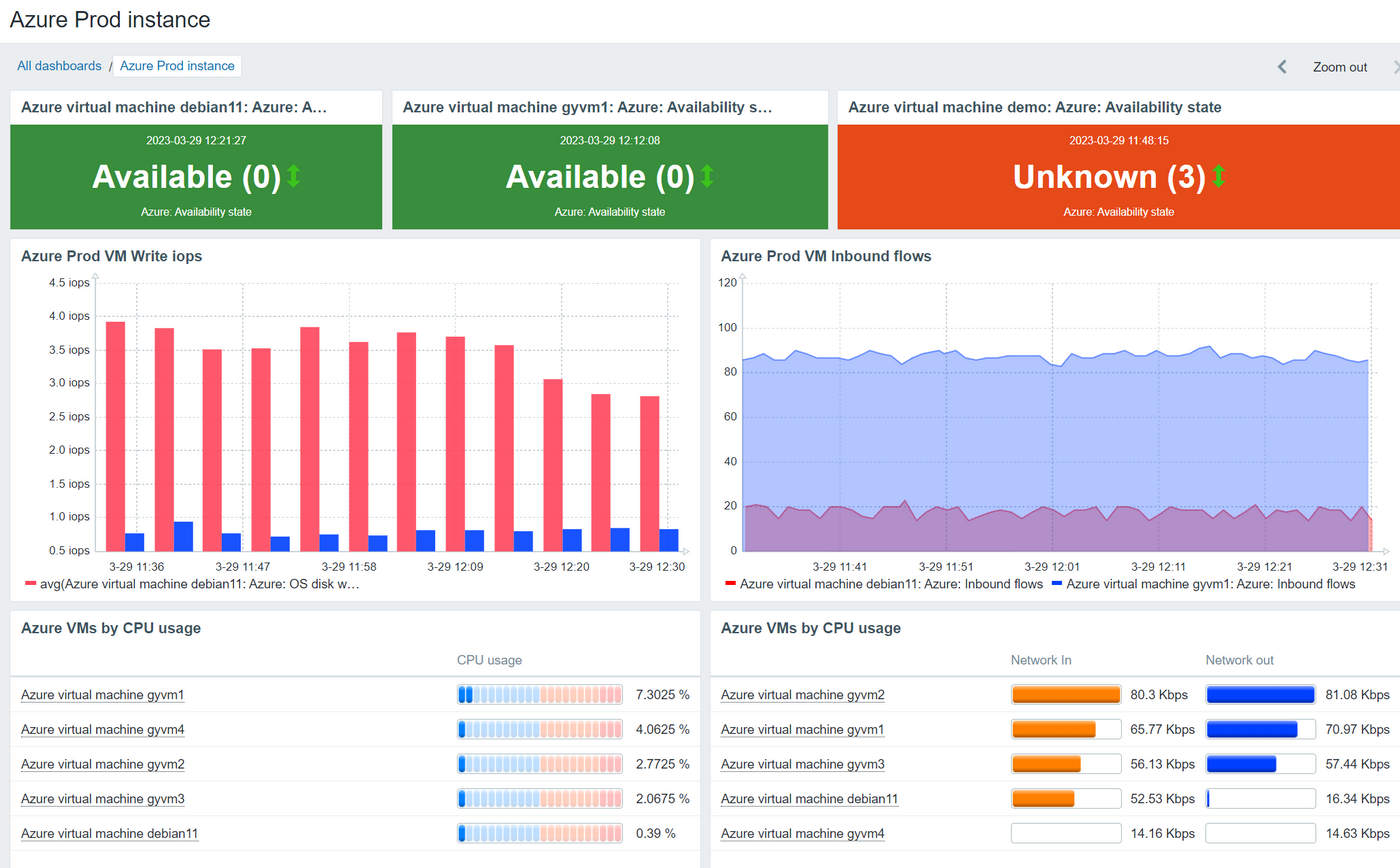
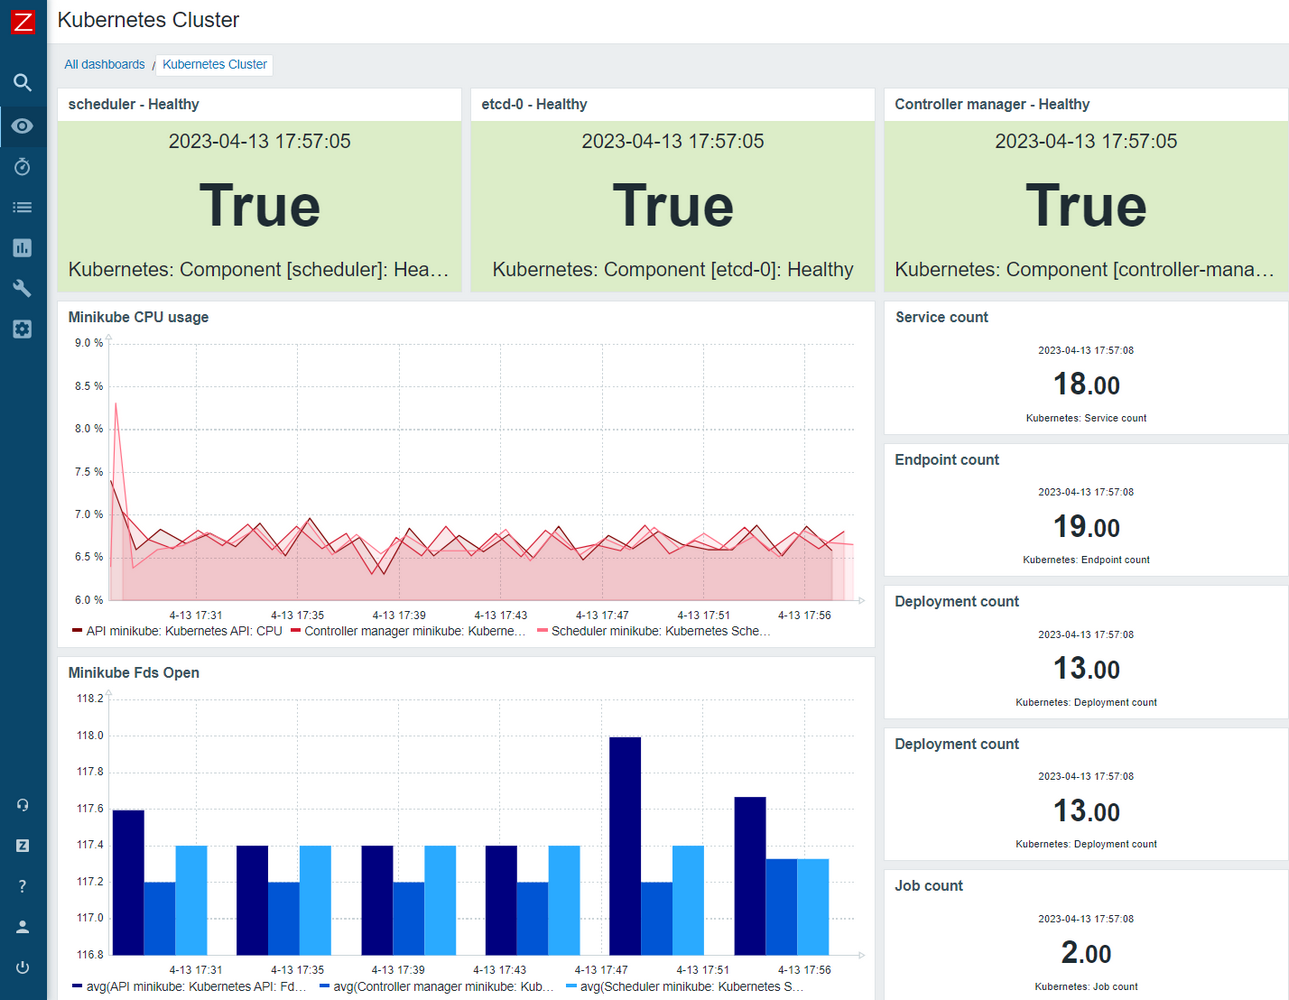
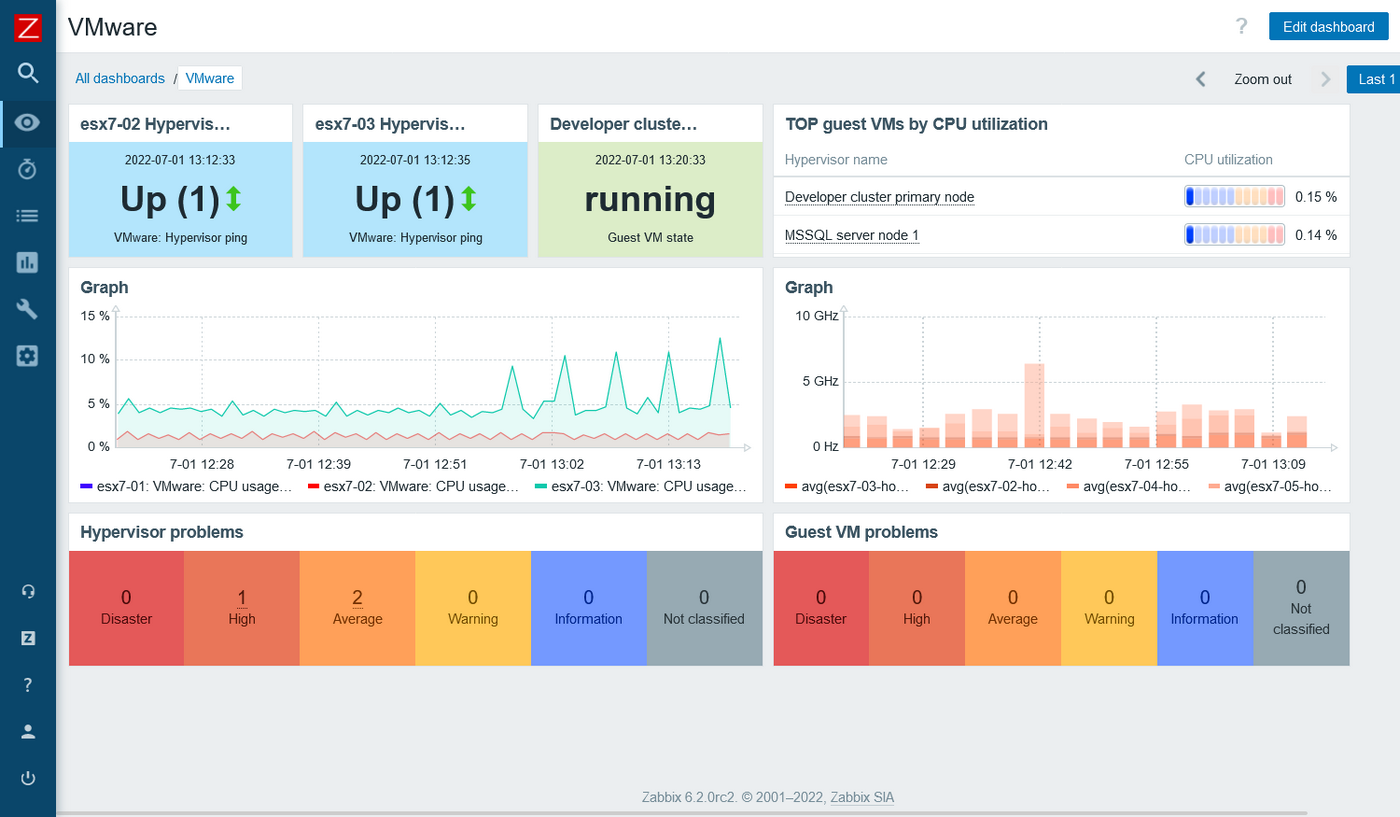
AWS, Azure, Kubernetes, and VMware dashboards