
5 Latest data
Overview
The section in Monitoring → Latest data can be used to view latest values gathered by items as well as to access various graphs for the items.
When you open this page for the first time, nothing is displayed.
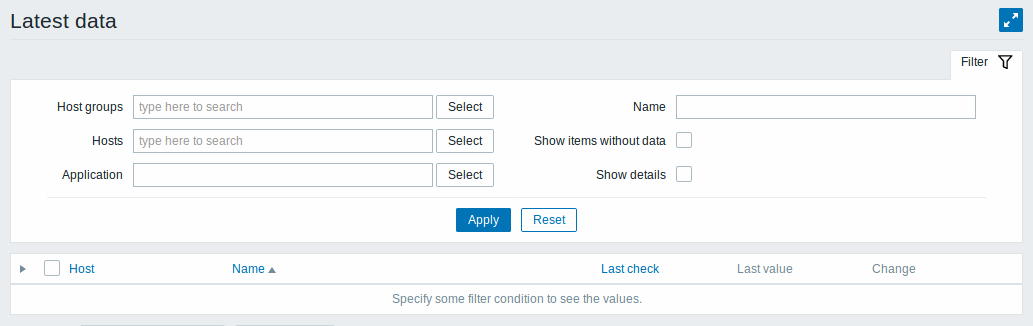
To access data, you need to make selections in the filter such as host group, host, application or item name.
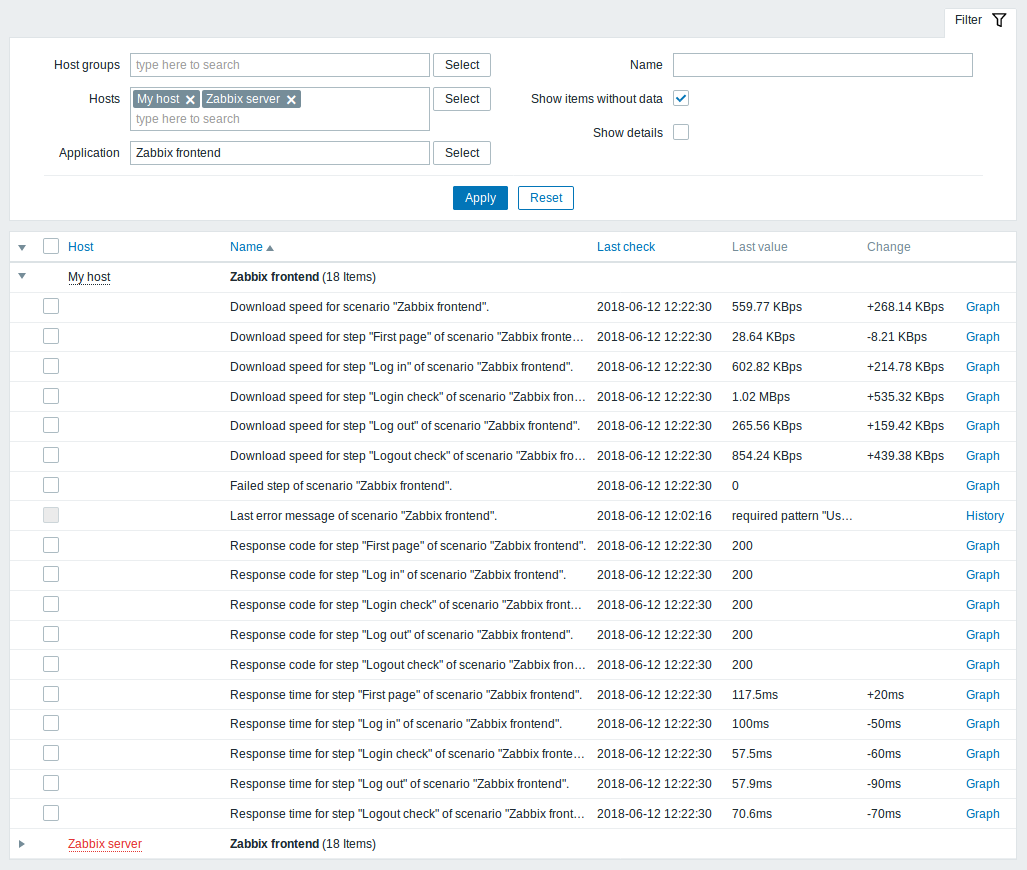
In the list displayed, click on
 before a host and the relevant application to reveal latest values of
that host and application. You can expand all hosts and all
applications, thus revealing all items by clicking on
in the header row.
before a host and the relevant application to reveal latest values of
that host and application. You can expand all hosts and all
applications, thus revealing all items by clicking on
in the header row.
Note: The name of a disabled host is displayed in red. Data of disabled hosts, including graphs and item value lists, is accessible in Latest data since Zabbix 2.2.0.
Items are displayed with their name, last check time, last value, change amount and a link to a simple graph/history of item values.
Only values that fall within the last 24 hours are displayed by default. This limit has been introduced with the aim of improving initial loading times for large pages of latest data. It is also possible to change this limitation by changing the value of ZBX_HISTORY_PERIOD constant in include/defines.inc.php.
For items with update frequency of 1 day or more the change amount will never be displayed (with the default setting). Also in this case the last value will not be displayed at all if it was received more than 24 hours ago.
Buttons
Buttons to the right offer the following options:
 |
Display page in fullscreen mode. |
 |
Display page in kiosk mode. In this mode only page content displayed. The kiosk mode button appears when the fullscreen mode is activated. To exit kiosk mode, move the mouse cursor until the  exit button appears and click on it. Note that you will be taken back to normal mode (not fullscreen mode). exit button appears and click on it. Note that you will be taken back to normal mode (not fullscreen mode). |
Using filter
You can use the filter to display only the items you are interested in. The Filter link is located above the table to the right. You can use it to filter items by host group, host, application, a string in the item name; you can also select to display items that have no data gathered.
Specifying a parent host group implicitly selects all nested host groups.
Show details allows to extend displayable information on the items. Such details as refresh interval, history and trends settings, item type and item errors (fine/unsupported) are displayed. A link to item configuration is also available.
By default, items without data are shown but details are not displayed.
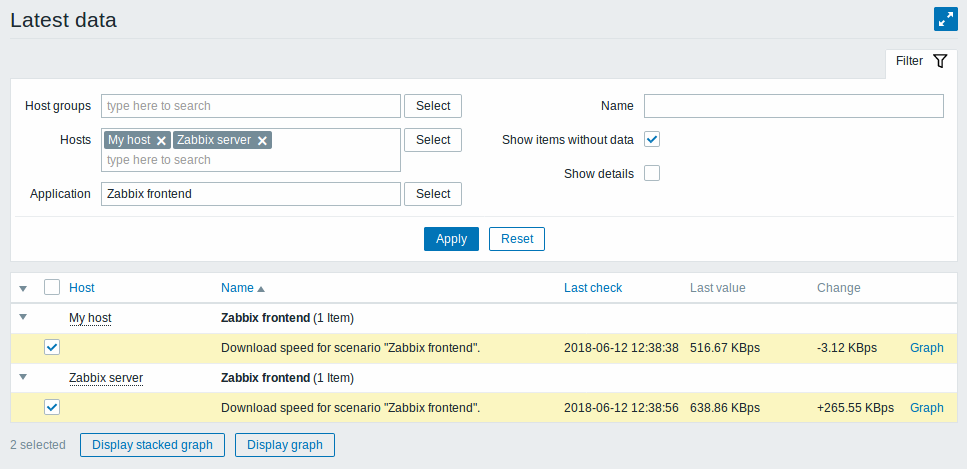
Ad-hoc graphs for comparing items
You may use the checkbox in the second column to select several items and then compare their data in a simple or stacked ad-hoc graph. To do that, select items of interest, then click on the required graph button below the table.
Links to value history/simple graph
The last column in the latest value list offers:
- a History link (for all textual items) - leading to listings (Values/500 latest values) displaying the history of previous item values.
<!-- -->- a Graph link (for all numeric items) - leading to a simple graph. However, once the graph is displayed, a dropdown on the upper right offers a possibility to switch to Values/500 latest values as well.
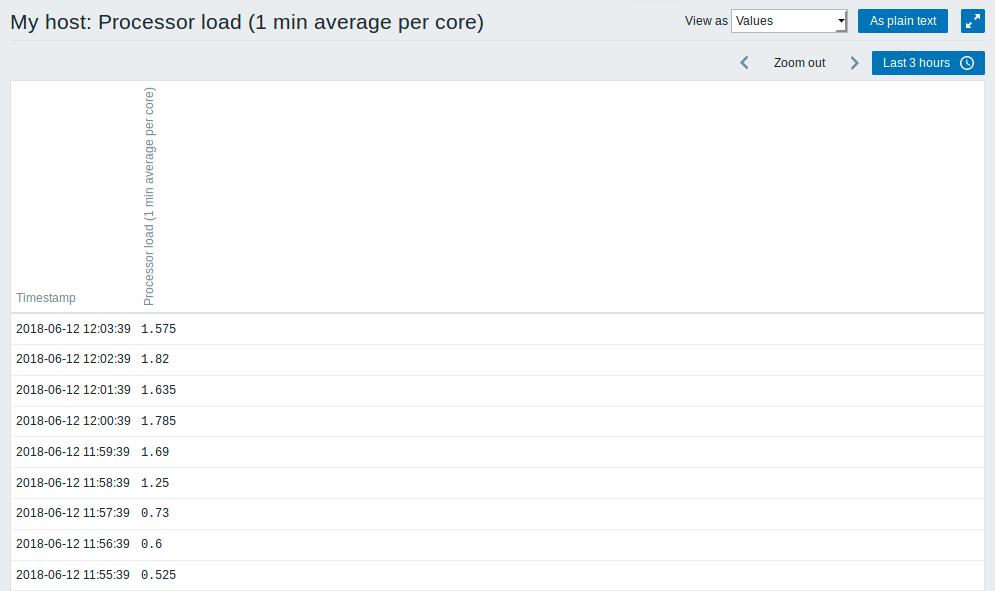
The values displayed in this list are "raw", that is, no postprocessing is applied.
The total amount of values displayed is defined by the value of Limit for search and filter results parameter, set in Administration → General.