
On this page
10 Services
Overview
In the Monitoring → Services section the status of IT infrastructure or business services is displayed.
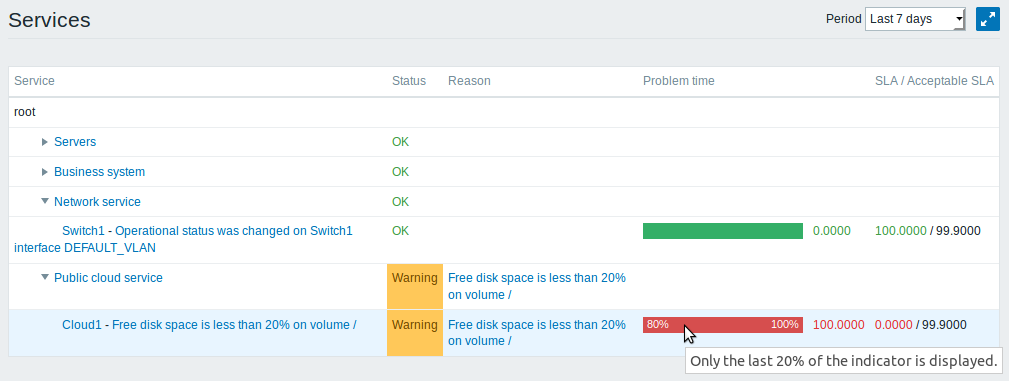
A list of the existing services is displayed along with data of their status and SLA. From the dropdown in the upper right corner you can select a desired period for display.
Displayed data:
| Parameter | Description |
|---|---|
| Service | Service name. |
| Status | Status of service: OK - no problems (trigger colour and severity) - indicates a problem and its severity |
| Reason | Indicates the reason of problem (if any). |
| Problem time | Displays SLA bar. Green/red ratio indicates the proportion of availability/problems. The bar displays the last 20% of SLA (from 80% to 100%). The bar contains a link to a graph of availability data. |
| SLA/Acceptable SLA | Displays current SLA/expected SLA value. If current value is below the acceptable level, it is displayed in red. |
You can also click on the service name to access the Service availability report.
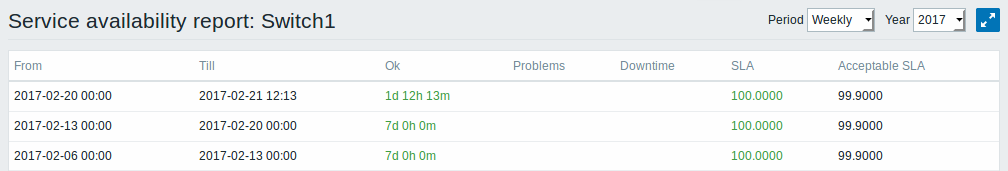
Here you can assess service availability data over a longer period of time on daily/weekly/monthly/yearly basis.
Buttons
Buttons to the right offer the following options:
 |
Display page in fullscreen mode. |
 |
Display page in kiosk mode. In this mode only page content displayed. The kiosk mode button appears when the fullscreen mode is activated. To exit kiosk mode, move the mouse cursor until the  exit button appears and click on it. Note that you will be taken back to normal mode (not fullscreen mode). exit button appears and click on it. Note that you will be taken back to normal mode (not fullscreen mode). |