
On this page
6 Graphs
Overview
In the Monitoring → Graphs section any custom graph that has been configured can be displayed.
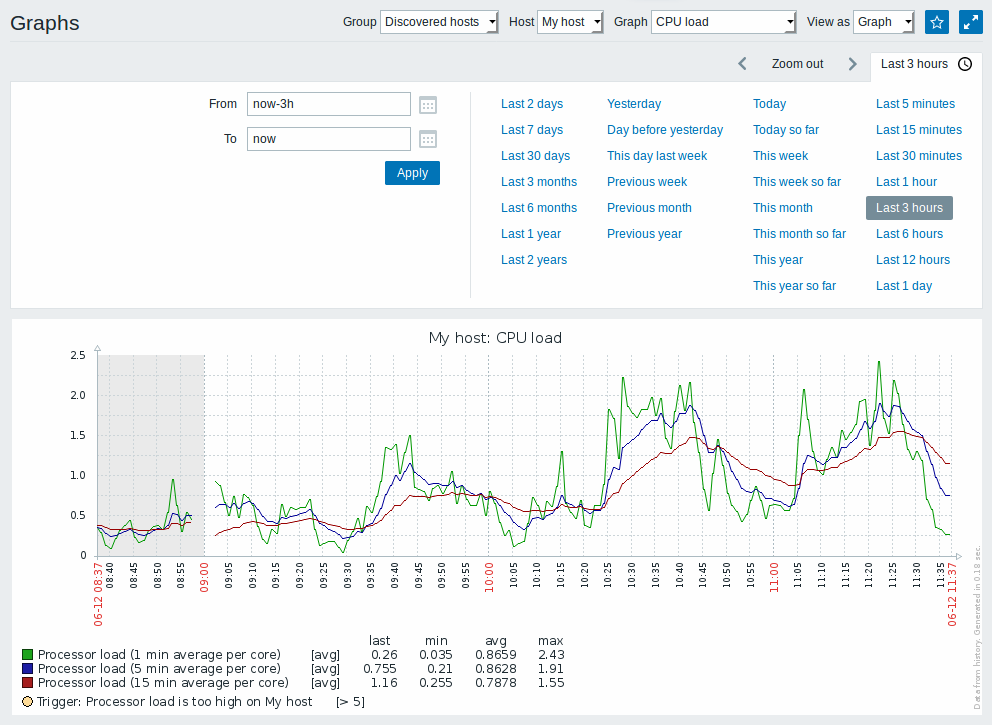
To display a graph, select the host group, host and then the graph from the dropdowns to the right.
Note: In the host dropdown, a disabled host is highlighted in red. Graphs for disabled hosts are accessible starting with Zabbix 2.2.0.
Time period selector
Take note of the time period selector above the graph. It allows to select often required periods with one mouse click.
See also: Time period selector
Buttons
Buttons to the right offer the following options:
 |
Add graph to the favourites widget in the Dashboard. |
 |
The graph is in the favourites widget in the Dashboard. Click to remove graph from the favourites widget. |
 |
Display page in fullscreen mode. |
 |
Display page in kiosk mode. In this mode only page content displayed. The kiosk mode button appears when the fullscreen mode is activated. To exit kiosk mode, move the mouse cursor until the  exit button appears and click on it. Note that you will be taken back to normal mode (not fullscreen mode). exit button appears and click on it. Note that you will be taken back to normal mode (not fullscreen mode). |