
- 5 What's new in Zabbix 5.0.0
- Vertical menu
- String comparison allowed
- Test item from UI
- No data triggers sensitive to proxy availability
- Custom frontend modules
- Copy and paste widgets
- Managing large numbers of hosts
- Overriding in LLD rules
- IPMI sensor discovery
- Item key limit raised
- Extended range of numeric (float) values
- ODBC monitoring without DSN
- Find and replace preprocessing step
- Nanosecond support by Zabbix sender input file
- Secure connections to Zabbix database
- Restricting agent checks
- Stronger cryptography for passwords
- Using HTTP proxy in webhooks
- Discovery rule filtering
- New mass update options
- Default messages for each media type
- Problem acknowledgment
- Unacknowledge option
- SNMP credentials at host interface level
- Manual SNMP cache clearing
- Email threading
- Elasticsearch 7 support
- SAML authentication
- Webhook integrations
- Zabbix agent 2
- Macros
- Databases
- New templates
- Items
- Frontend
- Minimum required PHP version
- Support of Internet Explorer 11 dropped
- Page selection dropdown integrated into headings
- New section for monitoring all hosts
- Detail editing as popup window
- New filtering options for dashboard widgets
- Ability to download graph widgets as images
- Filtering problems by severities in Monitoring→Problems
- Webhook media type test usability improved
- Miscellaneous
- Daemons
5 What's new in Zabbix 5.0.0
Vertical menu
A modern vertical menu in a sidebar replaces the horizontal menu in the new version.
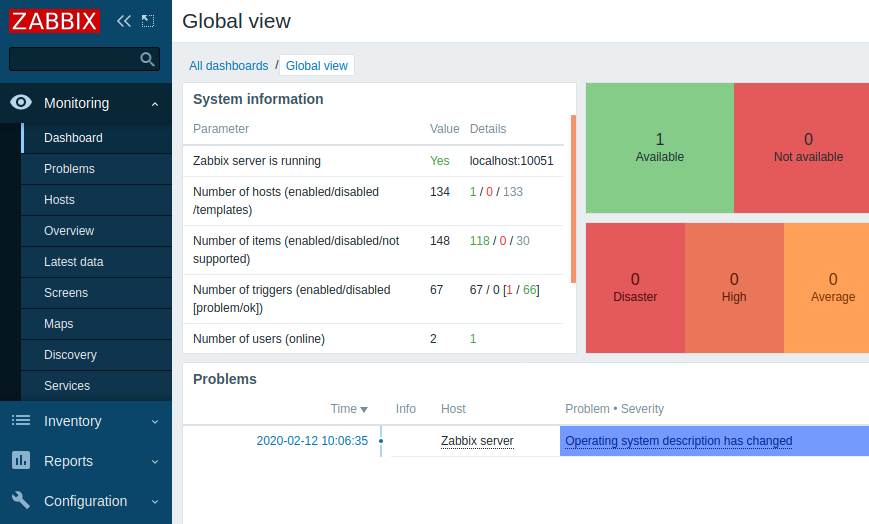
The menu can be collapsed or hidden completely:
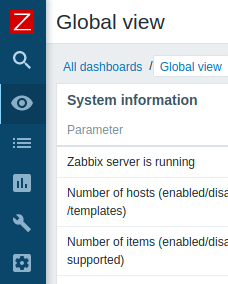 |
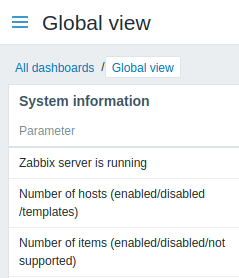 |
| Collapsed menu with icons only. | Hidden menu. |
When the menu is collapsed, a full menu reappears as soon as the mouse cursor is placed upon it. Even when the menu is hidden completely, a full menu is just one mouse click away. See additional details.
String comparison allowed
String comparison is now allowed in triggers, using the = (equal) and <> (not equal) operators.
So, for example, it is now possible to define triggers that create alarm if the strings returned by two items are different:
{Local Zabbix server:vfs.file.contents[/etc/os-release].last()}<>{Remote Zabbix server:vfs.file.contents[/etc/os-release].last()}String comparison is also possible in calculated items.
Test item from UI
In previous Zabbix versions, it was difficult to tell if a newly-configured item was configured correctly or not. For that you needed to wait until the item tried to gather some data.
In the new version it is possible to test the item (template item, item prototype, low-level discovery rule) from the user interface even before saving and, if configured correctly, get a real value in return.
Item testing is not supported for active items and some simple checks
(icmpping*, vmware.* items).
To test the item, click on the Test button at the bottom of the item configuration form.

The item testing form has fields for the required host parameters (host address, port, proxy name/no proxy). These fields are context aware:
- The values are pre-filled when possible, i.e. for items requiring an agent, by taking the information from the selected agent interface of the host
- The values have to be filled manually for template items
- The fields are disabled when not needed in the context of the item type (e.g. the host address field is disabled for calculated and aggregate items, the proxy field is disabled for calculated items)
To test the item, click on Get value. If the value is retrieved successfully, it will fill the Value field.
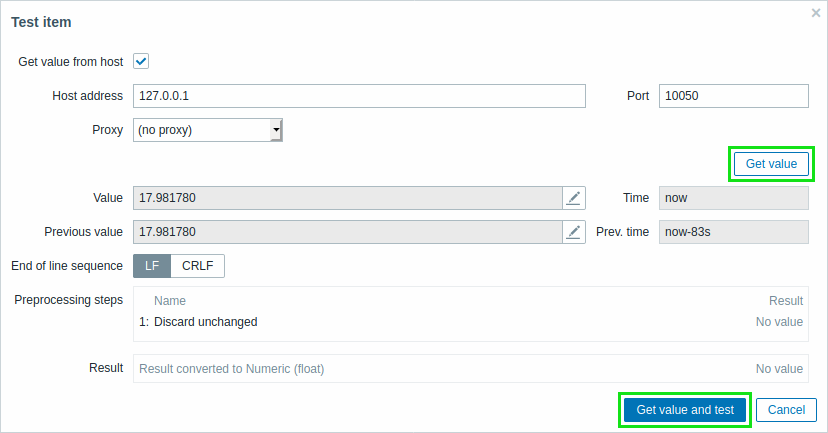
A successfully retrieved value from host can also be used to test the preprocessing steps.
In fact, the item testing form is an extension of the preprocessing testing form already known in recent Zabbix versions. So if previously you could test preprocessing steps only against a hypothetical input value, now it is also possible to test preprocessing against a real test value just received.
To test the preprocessing steps against the real value, click on Get value and test.
See also:
Execute now
In a related development the Check now option has been renamed to Execute now, to avoid confusing it with the item testing functionality.
No data triggers sensitive to proxy availability
No data triggers are now, by default, sensitive to proxy availability - the 'nodata' triggers will not fire immediately after a restored connection, but will skip the data for the delayed period.
Suppression is turned on:
- for passive proxies - if connection is restored more than 15 seconds and no less than 2 & ProxyUpdateFrequency seconds later
- for active proxies - if connection is restored more than 15 seconds later
You may also turn off sensitiveness to proxy availability, using the new second parameter, e.g.: nodata(5m,strict). In this case the function will work the same as before and fire as soon as the evaluation period (five minutes, in this case) without data is past.
It is also possible to monitor how long data are delayed on the proxy
using the new zabbix[proxy,<proxy name>,delay] internal
item.
Custom frontend modules
It is now possible to enhance Zabbix frontend functionality by adding third-party modules or by developing your own modules without the need to change the source code of Zabbix. See Modules for more information.
Copy and paste widgets
Dashboard widgets can be copied and pasted in the new version. They can be copy-pasted within the same dashboard, or between dashboards opened in different tabs.
A widget can be copied using the widget menu:
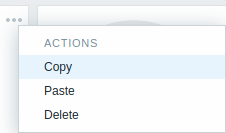
Then the copied widget can be used to create a new widget with the same properties. To paste a widget:
- use the Paste widget button when editing the dashboard
- use the Paste widget option when adding a new widget by selecting some area in the dashboard (a widget must copied first for the paste option to become available)

A copied widget can also be used to paste over an existing widget using the Paste option in the widget menu.
Managing large numbers of hosts
Several improvements have been made to make it easier to work with large numbers of hosts and other elements.
A consistent Zabbix feature in previous versions was the presence of many dropdowns for host and host group selection, and sometimes also for selecting other elements like graphs. Typical locations for these dropdowns included top of the page and popups. In the new version that has been changed in many locations (see the list of locations below):
- multi-select fields have replaced dropdowns in popups
- multi-select fields have replaced many dropdowns that were located top of the page; many of these fields have also been moved into filters
Note that:
- two host group and host dropdowns are in places changed to a single host multi-select field followed by a Select popup for host group selection
- there is also a new option to search for graph name pattern:
 |
Top-of-the-page selection dropdowns before Zabbix 5.0. |
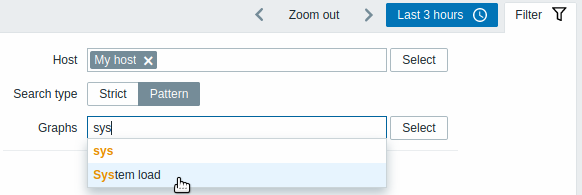 |
Multi-select fields in the filter in the new version. |
- filtering by host has been added to trigger/data overview pages and widgets
- the Rows per page setting from user profile is applied to web monitoring, host inventory overview and availability report pages
- hardcoded limit of 50 records without pagination is applied to trigger/data overview pages and widgets
Please see individual pages for details on changed host/host group/graph/etc selection:
- Monitoring:
- Dashboard (host selection with dynamic widgets)
- Host graphs
- Host web scenarios
- Trigger overview
- Data overview
- Screens/slide shows (host selection with dynamic screen elements)
- Inventory:
- Reports:
- Availability report (by host)
- Configuration lists:
Overriding in LLD rules
It is now possible to filter out items, triggers, hosts and graphs or override their attributes during low-level discovery based on LLD object and prototype name.
IPMI sensor discovery
A new ipmi.get IPMI item has been added that returns a JSON with
IPMI-sensor related information. This item can be used for the
discovery of IPMI
sensors.
Item key limit raised
The maximum allowed length of an item key has been raised from 256 to 2048 characters.
Extended range of numeric (float) values
Numeric (float) data type now supports precision of approximately 15 digits and range from approximately -1.79E+308 to 1.79E+308 (with exception of PostgreSQL 11 and earlier versions). This is by default for new installations. For upgraded installations, a manual patch must be applied.
ODBC monitoring without DSN
A new connection string parameter has been added to db.odbc.* items.
Now Database monitor
items can be configured in two ways:
- Using the data source name as set in /etc/odbc.ini
- Using a connection string
Find and replace preprocessing step
A new item value preprocessing option has been added allowing to find and replace a specified string with another:
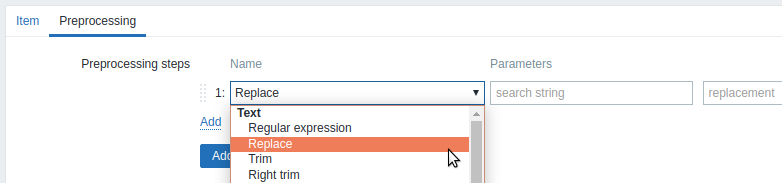
This step has two parameters:
- search string - the string to search for
- replacement - the string to replace the search string with. The replacement string may also be empty effectively allowing to delete the search string when found.
Nanosecond support by Zabbix sender input file
A new Zabbix sender option
-N, --with-nsallows to support nanoseconds in a Zabbix sender input file. This option
can be only used together with the --with-timestamps option, e.g.:
zabbix_sender -z 127.0.0.1 --with-timestamps --with-ns -i values.txtThis option specifies that each line of the input file contains the
following, whitespace-delimited:
<host> <key> <timestamp> <ns> <value>, e.g.:
Zabbix server" trap001 1429533600 748744024 43
Zabbix server" trap001 1429533600 748791234 44
Secure connections to Zabbix database
It is now possible to configure secure TLS connections to MySQL and PostgreSQL databases from:
Restricting agent checks
It is possible to restrict checks on the agent side by creating a whitelist or blacklist of allowed item keys.
Whitelist/blacklist is created using a combination of two new agent configuration parameters:
AllowKey=<pattern>- which checks are allowed; <pattern> is specified using a wildcard (*) expressionDenyKey=<pattern>- which checks are denied; <pattern> is specified using a wildcard (*) expression
See also: Restricting agent checks
Stronger cryptography for passwords
A stronger bcrypt cryptography is now used for hashing user passwords instead of MD5. The change to the stronger cryptography after the upgrade is automatic, i.e. no effort on the user side is required. Note that passwords longer than 72 characters will be truncated.
Using HTTP proxy in webhooks
It is now possible to specify an HTTP proxy when configuring a webhook. The new HTTPProxy parameter is listed in the webhook parameter list by default with an empty value.
When specifying the proxy value the same functionality as in the item configuration HTTP proxy field is supported.
Discovery rule filtering
The list of low-level discovery rules previously was always linked to a single host, making it impossible to view all discovery rules in one place or filter the ones of a specific host group or those having errors.
In the new version, the list of low-level discovery rules contains a filter allowing to filter by host group, host, discovery item type, discovery rule state and other parameters. Additionally, the added first column in the list now always displays the host of the discovery rule.
New mass update options
It is now possible to:
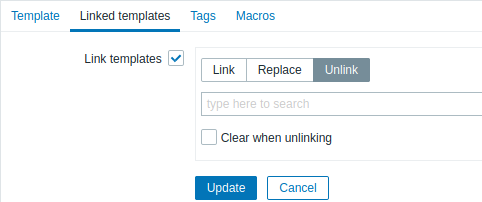
- Mass update user macros defined on a host or template level
- Mass unlink templates when using host or template mass update:
See also:
Default messages for each media type
It is now possible to specify default message templates for each event type when defining media types.
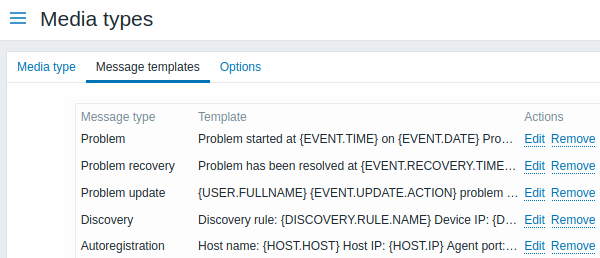
Thus default message editing no longer takes place when configuring action operations.
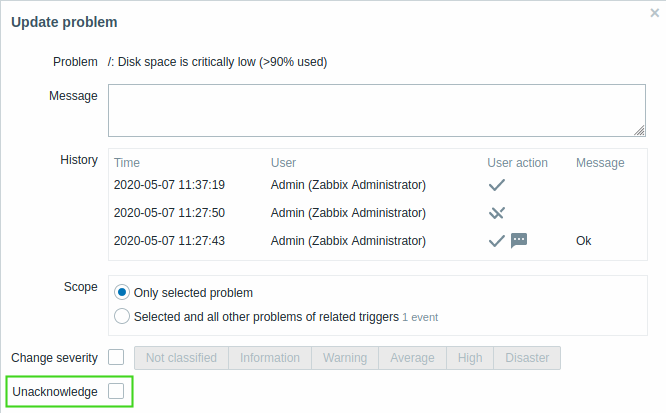
Problem acknowledgment
Several improvements have been made to the problem update screen used for problem acknowledgment and other problem update operations:
- The problem name is displayed (or N problems selected if there is more than one problem)
- Size of the problem update message has been increased from 256 to 2048 characters
- It is now possible to unacknowledge problems (see below)
Unacknowledge option
Problems may sometimes be acknowledged by mistake so to remedy this situation it is now also possible to unacknowledge problems. A problem may be unacknowledged in the problem update screen.
In the problem history list unacknowledgment gets a special icon:
![]()
SNMP credentials at host interface level
SNMP version and credentials in previous versions were set at an item level. In the new version, all of these can be set at a host interface level:
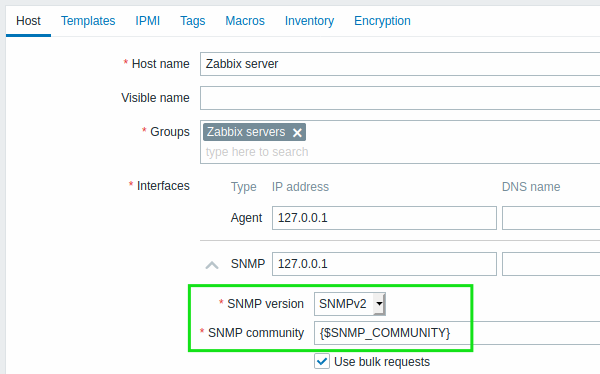
See also: Configuring SNMP monitoring
When creating an item, the item type dropdown no longer has three entries for SNMP v1, v2 and v3 agent. Instead there is just an SNMP agent type and the ability to select the SNMP interface as required.
Manual SNMP cache clearing
Zabbix server and Zabbix proxy now support an -R snmp_cache_reload
runtime control option, which
reloads the SNMP cache and clears the SNMP properties (engine time,
engine boots, engine id, credentials) for all hosts. Net-SNMP version
5.3.0 or higher is required.
Email threading
Email notifications related to the same event are now grouped into one thread.
Elasticsearch 7 support
Elasticsearch version 7.X is now supported. Support of older Elasticsearch versions has been dropped.
SAML authentication
SAML 2.0 authentication is now supported for logging into Zabbix.
Webhook integrations
New integrations are available allowing to use the webhook media type for pushing Zabbix notifications to:
Zabbix agent 2
Zabbix agent 2, first introduced on an experimental basis in Zabbix 4.4, is now officially supported. The functionality of the agent 2 has been extended:
Windows support
Agent 2 can now be compiled from sources on the Windows platform.
Docker monitoring plugin
A Docker plugin for Zabbix agent 2 is now available as part of the out-of-the-box monitoring of Docker containers (see list of supported keys).
Memcached monitoring plugin
A Memcached plugin for Zabbix agent 2 is now available as part of the out-of-the-box monitoring of Memcached instances (see description).
MySQL monitoring plugin
A MySQL plugin for Zabbix agent 2 is now available as part of the out-of-the-box monitoring of MySQL instances (see description).
Agent 2 plugins update
Passing a URI, username and password via plugin configuration parameters is now supported only for named sessions. As such, parameters in a format Plugins.<PluginName>.Uri, Plugins.<PluginName>.User, Plugins.<PluginName>.Password are no longer supported. Named session parameters in a format Plugins.<PluginName>.Sessions.<SessionName>.Uri, Plugins.<PluginName>.Sessions.<SessionName>.Password, Plugins.<PluginName>.Sessions.<SessionName>.User can be used.
Alternatively, a URI, username and password can be provided in the item key parameters directly.
See also:
Macros
Ability to mask macro content in the frontend
Macro value field now has Secret text mode. If enabled, it masks the content of a macro with asterisks to protect sensitive information, such as passwords or shared keys.
Macros supported in host prototypes
User macros can now be defined for host prototypes and LLD macros can be used in the macro value fields (the LLD macro will be resolved when a host is created from the prototype).
User macros supported in IPMI credentials
User macros are now supported in IPMI username and password fields in host configuration.
New macros
The following macros are now supported:
- {EVENT.DURATION} will return the duration of an event.
- {EVENT.TAGSJSON} and {EVENT.RECOVERY.TAGSJSON} macros will resolve to a JSON array containing event tag objects or recovery event tag objects.
For more details, see Macros supported by location.
Updated macros
- {HOST.ID} is now supported in trigger-based notifications and commands, problem update notifications and internal notifications.
Databases
Support of IBM DB2 dropped
The IBM DB2 database can no longer be used as a back-end database for Zabbix.
Minimum required versions updated
The minimum required versions for supported databases now are:
- MySQL 5.5.62
- MariaDB 10.0.37
- PostgreSQL 9.2.24
- Oracle 11.2
TimescaleDB native compression support
TimescaleDB native compression is now supported in Zabbix server installations with PostgreSQL version 10.2 or higher and TimescaleDB version 1.5 or higher.
New templates
New official templates are available for monitoring:
Elasticsearch
- Template App Elasticsearch Cluster by HTTP - native template to monitor Elasticsearch.
ClickHouse
- Template DB ClickHouse - collects node metrics from ClickHouse HTTP interface using HTTP agent. (see description).
Memcached
- Template App Memcached - Memcached server monitoring via Zabbix agent 2.
MySQL
- Template DB MySQL by Zabbix agent 2 - DBMS MySQL and its forks monitoring via Zabbix agent 2.
Docker
- Template App Docker - Docker monitoring via Zabbix agent 2.
Server
- Template Server Chassis by IPMI - server chassis monitoring with BMC over IPMI.
You can get these templates:
- In Configuration → Templates in new installations;
- When upgrading from previous versions, the latest templates can be downloaded from the Zabbix Git repository and manually imported into Zabbix in the Configuration → Templates section. If a template with the same name already exists, check the Delete missing option before importing to achieve a clean import. This way the items that have been excluded from the updated template will be removed (note that history of the deleted items will be lost).
Items
- The
zabbix[stats,<ip>,<port>]internal item now also returns version of Zabbix server or Zabbix proxy - A new
zabbix[version]internal item has been added returning the version of Zabbix server or Zabbix proxy
Frontend
Minimum required PHP version
The minimum required PHP version has been upped from 5.4.0 to 7.2.0.
Support of Internet Explorer 11 dropped
Microsoft Internet Explorer 11 is no longer supported by Zabbix.
Page selection dropdown integrated into headings
Some frontend sections in Zabbix may display a different page depending on user selection. For example, Administration → General may display twelve different pages.
Previously, the page selection was made in a rather small, easy-to-miss dropdown located in the top right corner of the page. Now that selection has been integrated into the headings on the left.
In Zabbix 5.0:
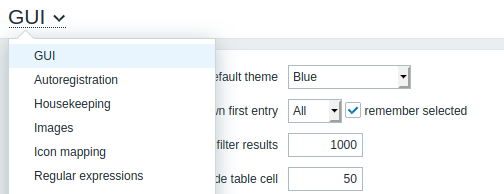
Before Zabbix 5.0:
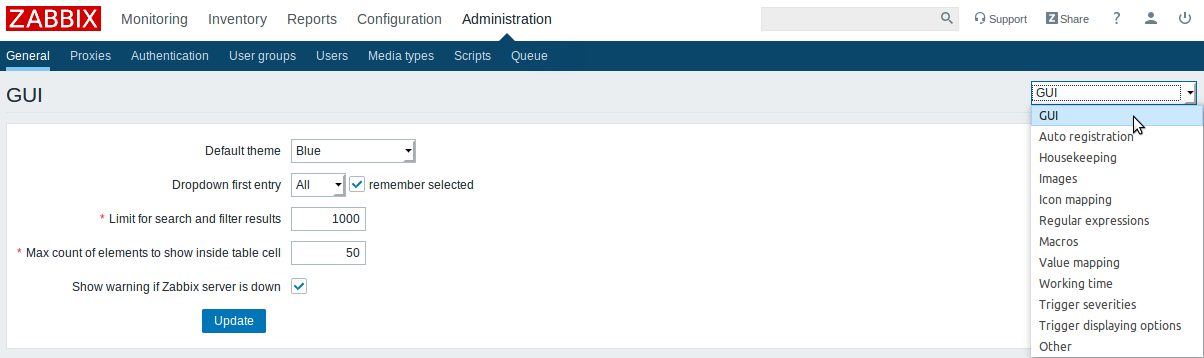
This change affects the following sections:
- Monitoring → Overview
- Monitoring → Screens
- Configuration → Actions
- Administration → General
- Administration → Queue
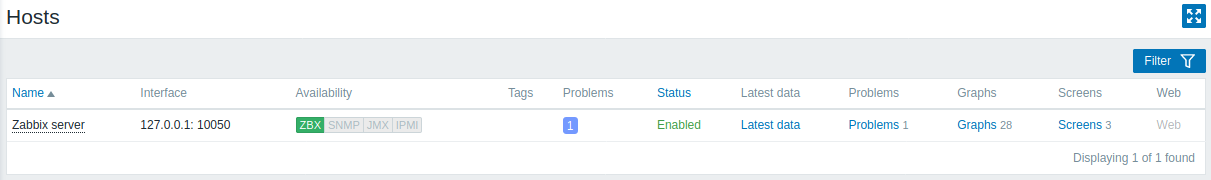
New section for monitoring all hosts
The new frontend section Monitoring → Hosts provides detailed view of all monitored devices in a single location. To simplify the navigation Web and Graphs sections have been removed from the main menu in Monitoring. Both sections can now be accessed by clicking on respected links in Monitoring → Hosts section.
The following information is available from Monitoring → Hosts:
- Hostname
- Main interface
- Availability
- Tags
- Problems (icons indicating currently open problems)
- Status
- Latest data (link to Latest data section)
- Problems (number of open problems and a link to Problems section)
- Graphs (number of graphs and a link to Graphs section)
- Screens (number of screens and a link to Screens section)
- Web scenarios (number of web scenarios and a link to Web section)
Links in the list above provide a convenient way to view corresponding page with more details about the given host. Users with admin and superadmin rights can also quickly navigate to the host's configuration page from the section. See this page for more details.
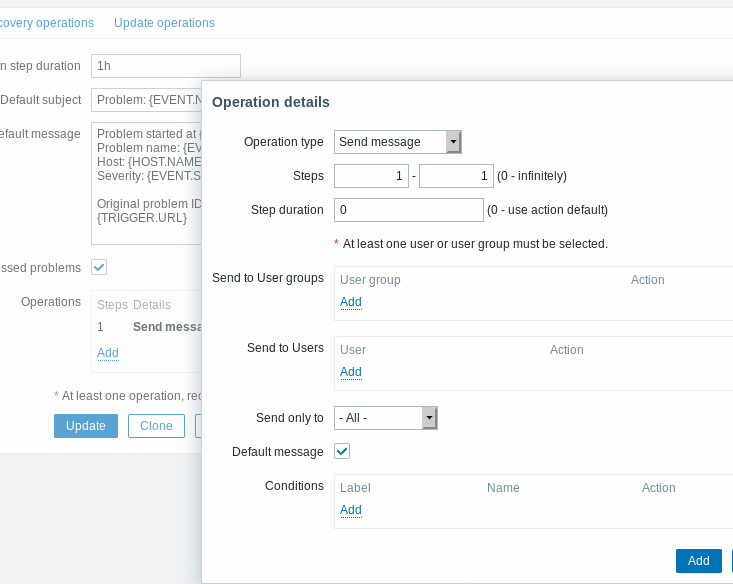
Detail editing as popup window
In several configuration sections of Zabbix frontend detail editing is now opened as a popup window. This is implemented for:
- Action conditions
- Global correlation conditions
- Problem update screen
- Action operation details
- in the Operations, Recovery operations and Update operations tabs
- Maintenance period details
- in the Periods tab
- Discovery rule details
- see discovery check editing
In many cases this change allows to de-clutter the interface of having to configure too many options in one screen. For example, details of an action operation are now opened in a separate popup window.
New filtering options for dashboard widgets
Dashboard widgets Problems by severity and Problem hosts now support filtering problems by tags.
Ability to download graph widgets as images
Screenshots of Graph widget and Graph (classic) widget can now be downloaded as .png files from the widget context menu.
Filtering problems by severities in Monitoring→Problems
Problems displayed in the Monitoring→ Problems section can now be filtered by one or several individually selected severities. Previously, there was only filtering by the minimum severity level available.
Webhook media type test usability improved
It is now possible to view log entries during a webhook media type test.
Miscellaneous
- The latest data page no longer displays nothing when opened for the first time.
- The list of web scenario HTTP user agents has been updated.
Daemons
Remote command logging on agent
Remote command logging, if enabled on Zabbix agent/agent2 (LogRemoteCommands=1) will no longer create log entries for system.run[] if it is launched locally by HostMetadataItem, HostInterfaceItem or HostnameItem parameters. system.run[] commands will be logged only if executed remotely.
Persistent storage on agent2
Zabbix agent2 is now able to store collected data for active checks in a persistent buffer (disabled by default). The following configuration parameters have been added:
- EnablePersistentBuffer
- PersistentBufferPeriod
- PersistentBufferFile
Crypto libraries
Support of the mbedTLS (PolarSSL) crypto library has been discontinued.
JMX monitoring attributes with tabular data
Support of tabular data objects in JMX Mbean attributes has been added. It is supported for the JMX agent data collection and low-level discovery.