
1 Dashboard
Overview
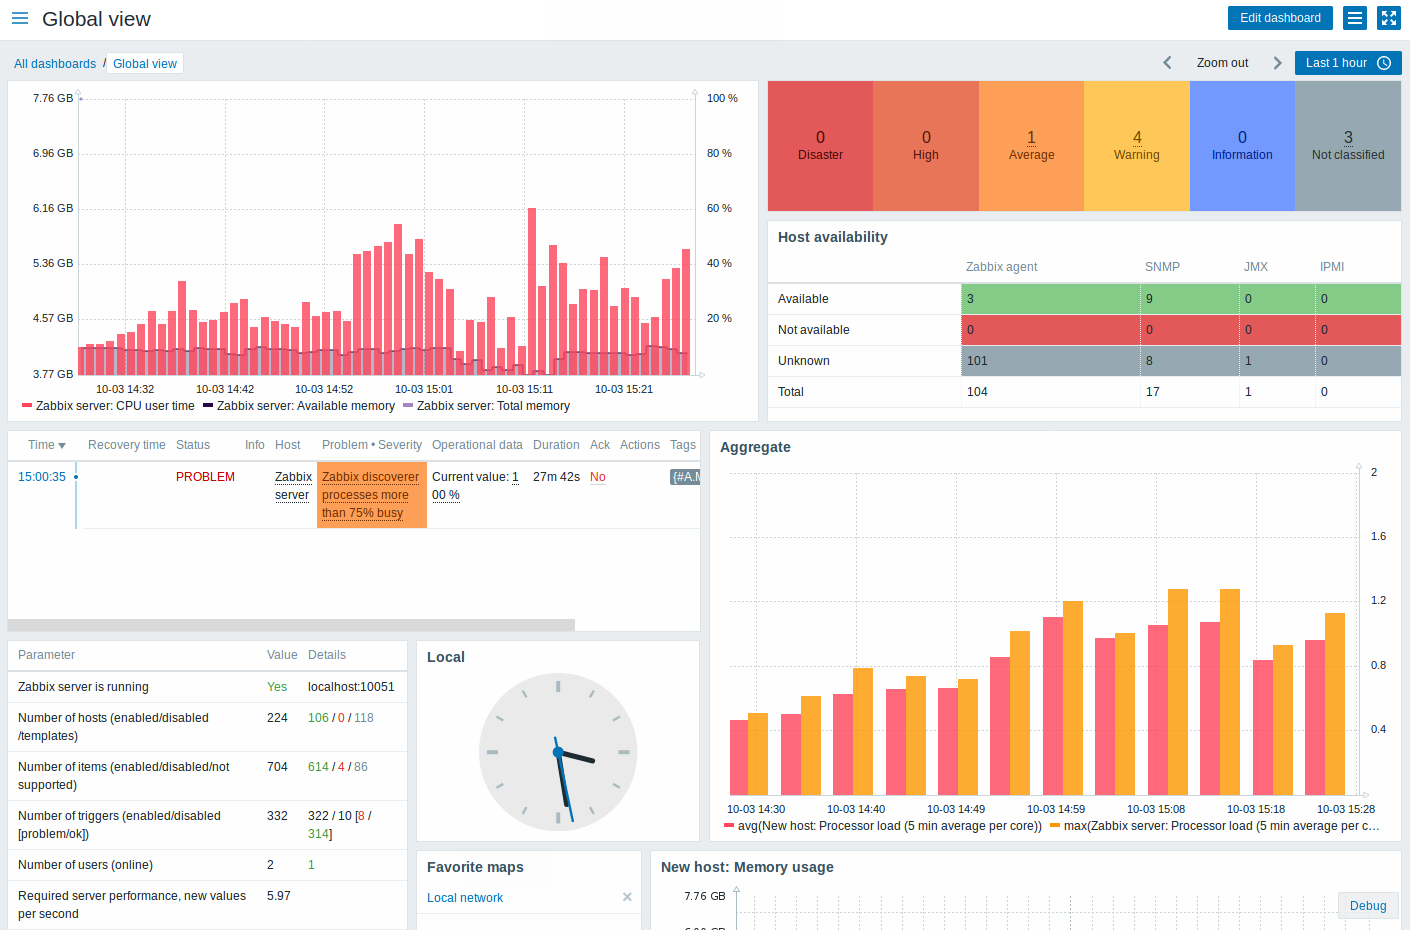
The Monitoring → Dashboard section is designed to display summaries of all the important information.
A dashboard consists of widgets and each widget is designed to display information of a certain kind and source, which can be a summary, a map, a graph, the clock, etc.
Access to hosts in the widgets depends on host permissions.
Widgets are added and edited in the dashboard editing mode. Widgets are viewed in the dashboard viewing mode.
While in a single dashboard you can group widgets from various sources for a quick overview, it is also possible to create several dashboards containing different sets of overviews and switch between them.
The time period that is displayed in graph widgets is controlled by the time period selector located above the widgets. The time period selector label, located to the right, displays the currently selected time period. Clicking the tab label allows to expand and collapse the time period selector.
Note that when the dashboard is displayed in kiosk mode and widgets only are displayed, it is possible to zoom out the graph period by double clicking in the graph.
Viewing dashboards
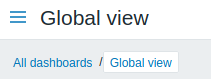
To access all configured dashboards, click on the All dashboards link just below the section title.
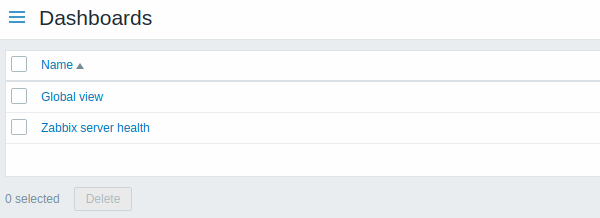
To view a single dashboard, click on its name in the list of all dashboards.
To delete one or several dashboards, mark the checkboxes of the respective dashboards and click on Delete below the list.
Creating a dashboard
When viewing all dashboards, you can click on the Create dashboard button to create a new dashboard:
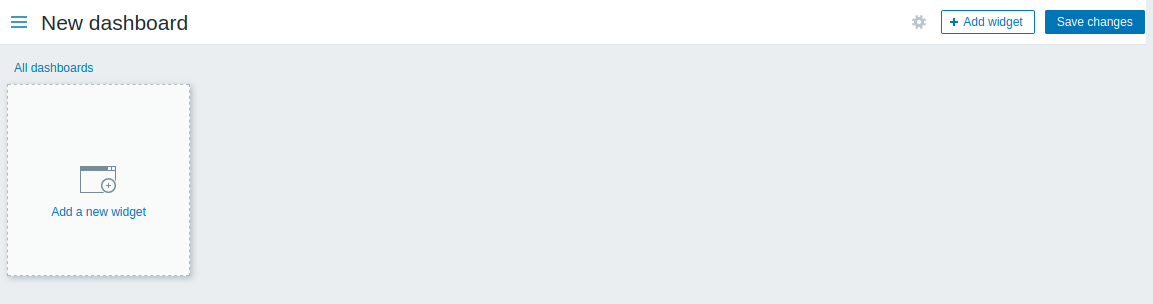
Initially the dashboard is empty. To populate the dashboard, you can add widgets.
Click on the Save changes button to save the dashboard. If you click on Cancel, the dashboard will not be created.
Adding widgets
To add a widget to a dashboard:
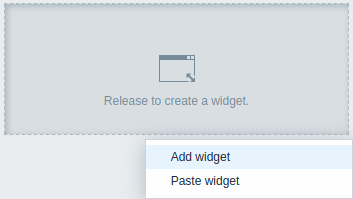
- Click on the Add widget button in dashboard editing mode. The widget will be created in its default size and placed after the existing widgets (if any);
Or
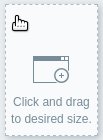
- Move your mouse to the desired empty spot for the new widget. Notice how a placeholder appears, on mouseover, on any empty slot on the dashboard. Then click to open the widget configuration form. After filling the form the widget will be created in its default size or take up all the available space if its default size is bigger. Alternatively you may click and drag the placeholder to the desired widget size, then release. (When releasing you may need to click on Add widget if the Paste widget from a copied widget option is also available.)
Then, in the widget configuration form:
- Select the Type of widget
- Enter widget parameters
- Click on Add
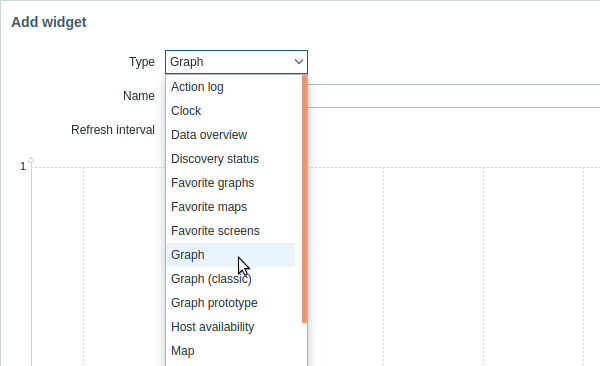
The following widgets can be added to a dashboard:
- Action log
- Clock
- Data overview
- Discovery status
- Favorite graphs
- Favorite maps
- Favorite screens
- Graph
- Graph (classic)
- Graph prototype
- Host availability
- Problem hosts
- Map
- Map navigation tree
- Plain text
- Problems
- System information
- Problems by severity
- Trigger overview
- URL
- Web monitoring
In dashboard editing mode widgets can be resized and moved around the dashboard by clicking on the widget title bar and dragging it to a new location. Also, you can click on the following buttons in the top-right corner of the widget to:
 -
edit a widget;
-
edit a widget; -
access the widget menu
-
access the widget menu
Click on Save changes for the dashboard to make any changes to the widgets permanent.
Widget menu
The widget menu contains different options based on whether the dashboard is in the edit or view mode:
| Widget menu | Options |
|---|---|
In dashboard edit mode: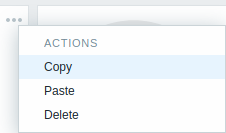 |
Copy - copy the widget Paste - paste a copied widget over this widget This option is grayed out if no widget has been copied. Delete - delete the widget |
In dashboard view mode: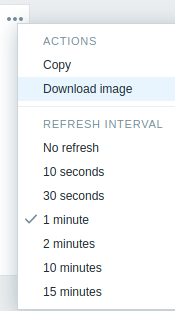 |
Copy - copy the widget Download image - download the widget as a PNG image (only available for graph/classic graph widgets) Refresh interval - select the frequency of refreshing the widget contents |
Copying/pasting widgets
Dashboard widgets can be copied and pasted. They can be copy-pasted within the same dashboard, or between dashboards opened in different tabs.
A widget can be copied using the widget menu. Then the copied widget can be used to create a new widget with the same properties:
- using the Paste widget button when editing the dashboard
- using the Paste widget option when adding a new widget by selecting some area in the dashboard (a widget must copied first for the paste option to become available)
A copied widget can be used to paste over an existing widget using the Paste option in the widget menu.
Dynamic widgets
When configuring some of the widgets:
- Classic graph
- Graph prototype
- Plain text
- URL
there is an extra option called Dynamic item. You can check this box to make the widget dynamic - i.e. capable of displaying different content based on the selected host.
Now, when saving the dashboard, you will notice that a new host selection field has appeared atop the dashboard for selecting the host (while the Select button allows to select the host group in a popup):

Thus you have a widget, which can display content that is based on the data from the host that is selected. The benefit of this is that you do not need to create extra widgets just because, for example, you want to see the same graphs containing data from various hosts.
Viewing and editing a dashboard
When viewing a single dashboard, the following options are available:
 |
Switch to the dashboard editing mode. | |
 |
Open the action menu (see description of the available actions below). | |
| Sharing | Edit sharing preferences for the dashboard. Dashboards can be made public or private. Public dashboards are visible to all users. Private dashboards are visible only to their owner. Private dashboards can be shared by the owner to other users and user groups. For details on configuring sharing, see the map configuration section. |
|
| Create new | Create a new dashboard. First you are prompted to enter general properties of the new dashboard - owner and name. Then, the new dashboard opens in editing mode and you can add widgets. |
|
| Clone | Create a new dashboard by copying properties of the existing one. First you are prompted to enter general properties of the new dashboard - owner and name. Then, the new dashboard opens in editing mode with all the widgets of the original dashboard. |
|
| Delete | Delete the dashboard. | |
 |
Display only page content (kiosk mode). Kiosk mode can also be accessed with the following URL parameters: /zabbix.php?action=dashboard.view&kiosk=1To exit to normal mode: /zabbix.php?action=dashboard.view&kiosk=0 |
|
Editing mode is opened:
- when a new dashboard is being created
- when you click on the
edit button of a widget
- when you click the Edit dashboard button for an existing dashboard
In the dashboard editing mode the following options are available:
 |
Edit general dashboard properties - name and owner. |
 |
Add a new widget. |
 |
Paste a copied widget. This button is grayed out if no widget has been copied. |
 |
Save dashboard changes. |
 |
Cancel dashboard changes. |
Permissions to dashboards
Permissions to dashboards for regular and Zabbix Admin users are limited in the following way:
- They can see and clone a dashboard if they have at least READ rights to it;
- They can edit and delete dashboard only if they have READ/WRITE rights to it;
- They cannot change the dashboard owner.
Host menu
Clicking on a host in the Problems widget brings up the host menu. It includes links to custom scripts, inventory, latest data, problems, graphs, screens, web scenarios and configuration for the host. Note that host configuration is available for Admin and Superadmin users only.
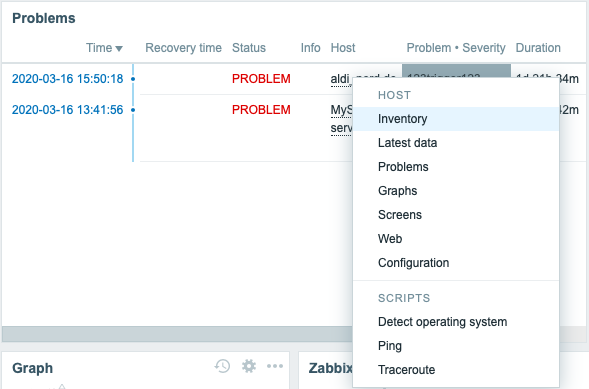
The host menu is accessible by clicking on a host in several other frontend sections:
- Monitoring → Problems
- Monitoring → Problems → Event details
- Monitoring → Hosts
- Monitoring → Hosts → Web Monitoring (since 5.0.4)
- Monitoring → Overview (on Hosts: left)
- Monitoring → Latest data
- Monitoring → Screens (in Host issues and Host group issues widgets)
- Monitoring → Maps
- Reports → Triggers top 100
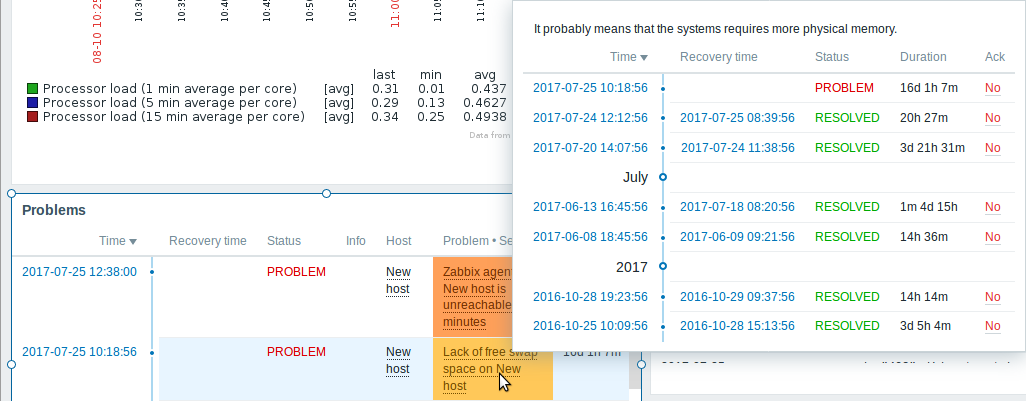
Problem event popup
The problem event popup includes the list of problem events for this trigger and, if defined, the trigger description and a clickable URL.
To bring up the problem event popup:
- roll a mouse over the problem name in the Problem-Severity column of the Problems widget. The popup disappears once you remove the mouse from the problem name.
- click on the problem name in the Problem-Severity column of the Problems widget. The popup disappears only if you click on the problem name again.