
10. Virtual machine monitoring
Overview
Support of monitoring VMware environments is available in Zabbix starting with version 2.2.0.
Zabbix can use low-level discovery rules to automatically discover VMware hypervisors and virtual machines and create hosts to monitor them, based on pre-defined host prototypes.
The default dataset in Zabbix offers several ready-to-use templates for monitoring VMware vCenter or ESX hypervisor.
The minimum required VMware vCenter or vSphere version is 5.1.
Details
The virtual machine monitoring is done in two steps. First, virtual machine data is gathered by vmware collector Zabbix processes. Those processes obtain necessary information from VMware web services over the SOAP protocol, pre-process it and store into Zabbix server shared memory. Then, this data is retrieved by pollers using Zabbix simple check VMware keys.
Starting with Zabbix version 2.4.4 the collected data is divided into 2 types: VMware configuration data and VMware performance counter data. Both types are collected independently by vmware collectors. Because of this it is recommended to enable more collectors than the monitored VMware services. Otherwise retrieval of VMware performance counter statistics might be delayed by the retrieval of VMware configuration data (which takes a while for large installations).
Currently only datastore, network interface and disk device statistics and custom performance counter items are based on the VMware performance counter information.
Configuration
For virtual machine monitoring to work, Zabbix should be compiled with the --with-libxml2 and --with-libcurl compilation options.
The following configuration file options can be used to tune the Virtual machine monitoring:
- StartVMwareCollectors - the number of pre-forked vmware
collector instances.
This value depends on the number of VMware services you are going to monitor. For the most cases this should be:
servicenum < StartVMwareCollectors < (servicenum * 2)
where servicenum is the number of VMware services. E. g. if you have 1 VMware service to monitor set StartVMwareCollectors to 2, if you have 3 VMware services, set it to 5. Note that in most cases this value should not be less than 2 and should not be 2 times greater than the number of VMware services that you monitor. Also keep in mind that this value also depends on your VMware environment size and VMwareFrequency and VMwarePerfFrequency configuration parameters (see below). - VMwareCacheSize
- VMwareFrequency
- VMwarePerfFrequency
- VMwareTimeout
For more details, see the configuration file pages for Zabbix server and proxy.
To support datastore capacity metrics Zabbix requires VMware configuration vpxd.stats.maxQueryMetrics parameter to be at least 64. See also the VMware knowledge base article.
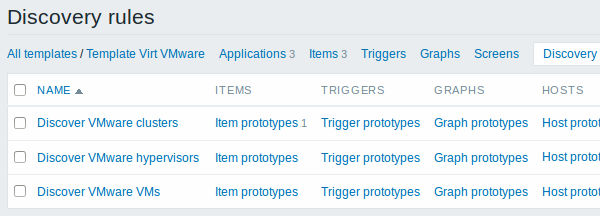
Discovery
Zabbix can use a low-level discovery rule to automatically discover VMware hypervisors and virtual machines.
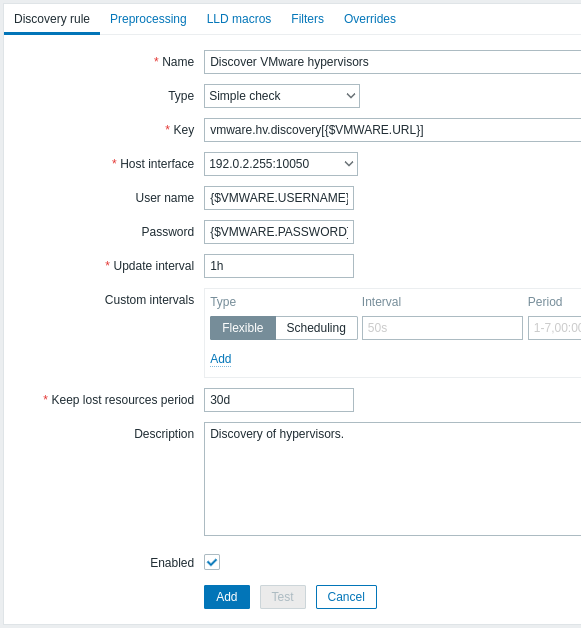
All mandatory input fields are marked with a red asterisk.
Discovery rule key in the above screenshot is vmware.hv.discovery[{$VMWARE.URL}].
Host prototypes
Host prototypes can be created with the low-level discovery rule. When virtual machines are discovered, these prototypes become real hosts. Prototypes, before becoming discovered, cannot have their own items and triggers, other than those from the linked templates. Discovered hosts will belong to an existing host and will take the IP of the existing host for the host configuration.
In a host prototype configuration, LLD macros are used for the host name, visible name and host group prototype fields. It is also possible to define user macros with LLD macros as values. Linkage to existing host groups, template linkage and encryption are other options that can be set.
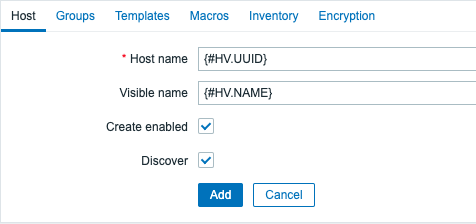
If Create enabled is checked, the host will be added in an enabled state. If unchecked, the host will be added, but in disabled state.
If Discover is checked (default), the host will be created. If unchecked, the host will not be created, unless this setting is overridden in the discovery rule. This functionality provides additional flexibility when creating discovery rules.
Discovered hosts are prefixed with the name of the discovery rule that created them, in the host list. Discovered hosts can be manually deleted. Discovered hosts will also be automatically deleted, based on the Keep lost resources period (in days) value of the discovery rule. Most of the configuration options are read-only, except for enabling/disabling the host and host inventory.
Zabbix does not support nested host prototypes, i.e. host prototypes are not supported on hosts that are discovered by low-level discovery rule.
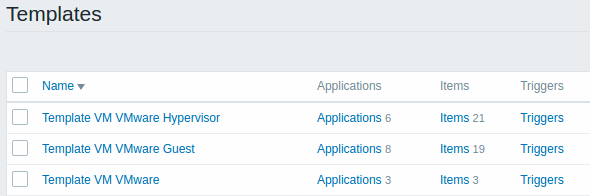
Ready-to-use templates
The default dataset in Zabbix offers several ready-to-use templates for monitoring VMware vCenter or directly ESX hypervisor.
These templates contain pre-configured LLD rules as well as a number of built-in checks for monitoring virtual installations. Note that:
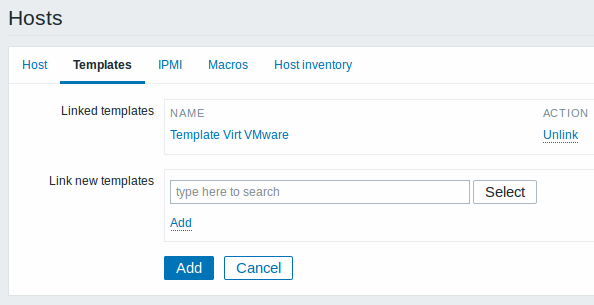
- The "Template VM VMware" template should be used for VMware vCenter and ESX hypervisor monitoring;
- The "Template VM VMware Hypervisor" and "Template VM VMware Guest" templates are used by discovery and normally should not be manually linked to a host.
If your server has been upgraded from a pre-2.2 version and has no such templates, you can import them manually, downloading from the community page with official templates. However, these templates have dependencies from the VMware VirtualMachinePowerState and VMware status value maps, so it is necessary to create these value maps first (using an SQL script, manually or importing from an XML) before importing the templates.
Host configuration
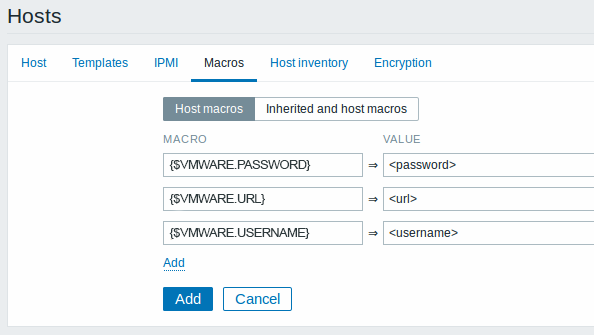
To use VMware simple checks the host must have the following user macros defined:
- {$VMWARE.URL} - VMware service (vCenter or ESX hypervisor) SDK URL (https://servername/sdk)
- {$VMWARE.USERNAME} - VMware service user name
- {$VMWARE.PASSWORD} - VMware service {$VMWARE.USERNAME} user password
Example
The following example demonstrates how to quickly setup VMware monitoring on Zabbix:
- compile zabbix server with required options (--with-libxml2 and --with-libcurl)
- set the StartVMwareCollectors option in Zabbix server configuration file to 1 or more
- create a new host
- set the host macros required for VMware authentication:
- link the host to the VMware service template:
- click on the Add button to save the host.
Extended logging
The data gathered by VMware collector can be logged for detailed
debugging using debug level 5. This level can be set in
server and
proxy configuration files or
using a runtime control option
(-R log_level_increase="vmware collector,N", where N is a process
number). The following examples demonstrate how extended logging can be
started provided debug level 4 is already set:
Increase log level of all vmware collectors:
shell> zabbix_server -R log_level_increase="vmware collector"

Increase log level of second vmware collector:
shell> zabbix_server -R log_level_increase="vmware collector,2"
If extended logging of VMware collector data is not required it can be
stopped using the -R log_level_decrease option.
Troubleshooting
- In case of unavailable metrics, please make sure if they are not made unavailable or turned off by default in recent VMware vSphere versions or if some limits are not placed on performance-metric database queries. See ZBX-12094 for additional details.
<!-- -->- In case of 'config.vpxd.stats.maxQueryMetrics' is invalid or
exceeds the maximum number of characters permitted** error, add a
config.vpxd.stats.maxQueryMetricsparameter to the vCenter Server settings. The value of this parameter should be the same as the value ofmaxQuerysizein VMware's web.xml. See this VMware knowledge base article for details.